

Short answer: what Topic Insights gives you
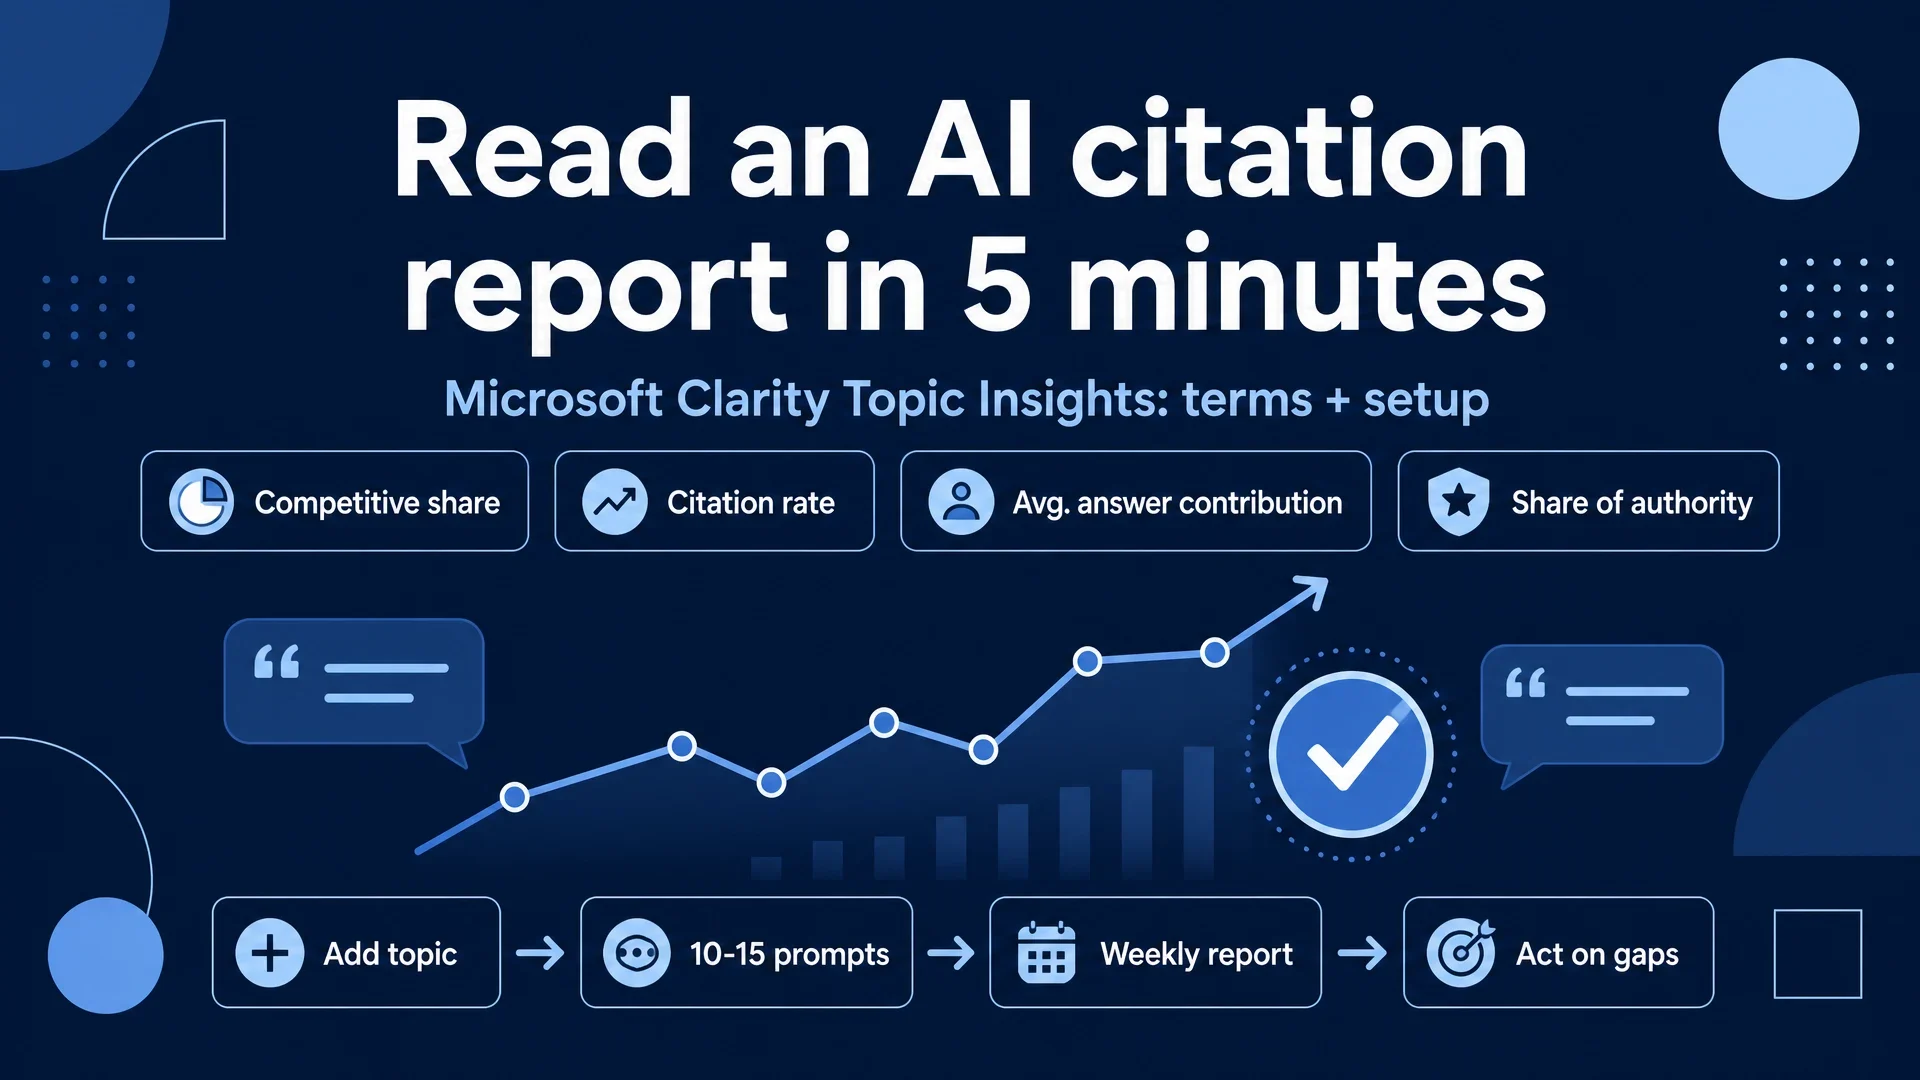
Microsoft Clarity's Topic Insights (part of AI Visibility, still in beta) takes a list of questions you write, the kind your audience would actually ask an AI assistant, runs them through a live AI model, and reports which domains get cited in the answers. The report tells you three things at once: how often your site shows up, whether you lead the conversation or just get mentioned, and which subtopics other domains own where you don't.
This guide is the copy you wish were next to the screen: every label and tooltip on the page, translated into what it actually means and what to do after reading it. By the end you'll know exactly what to click, what a good score looks like, and when a number means nothing.
- Who it's for: any site owner with a Microsoft account and the Clarity tracking code on their site. No paid plan, no AI-search toolkit licenses.
- What you get in the end: one topic defined, its first report generated, and a shortlist of content gaps worth writing.
- Time: about 30 minutes of setup, then one review per week.
- Done when: you have read a report and picked one "Top content opportunities" item to act on.
The two dashboards inside AI Visibility
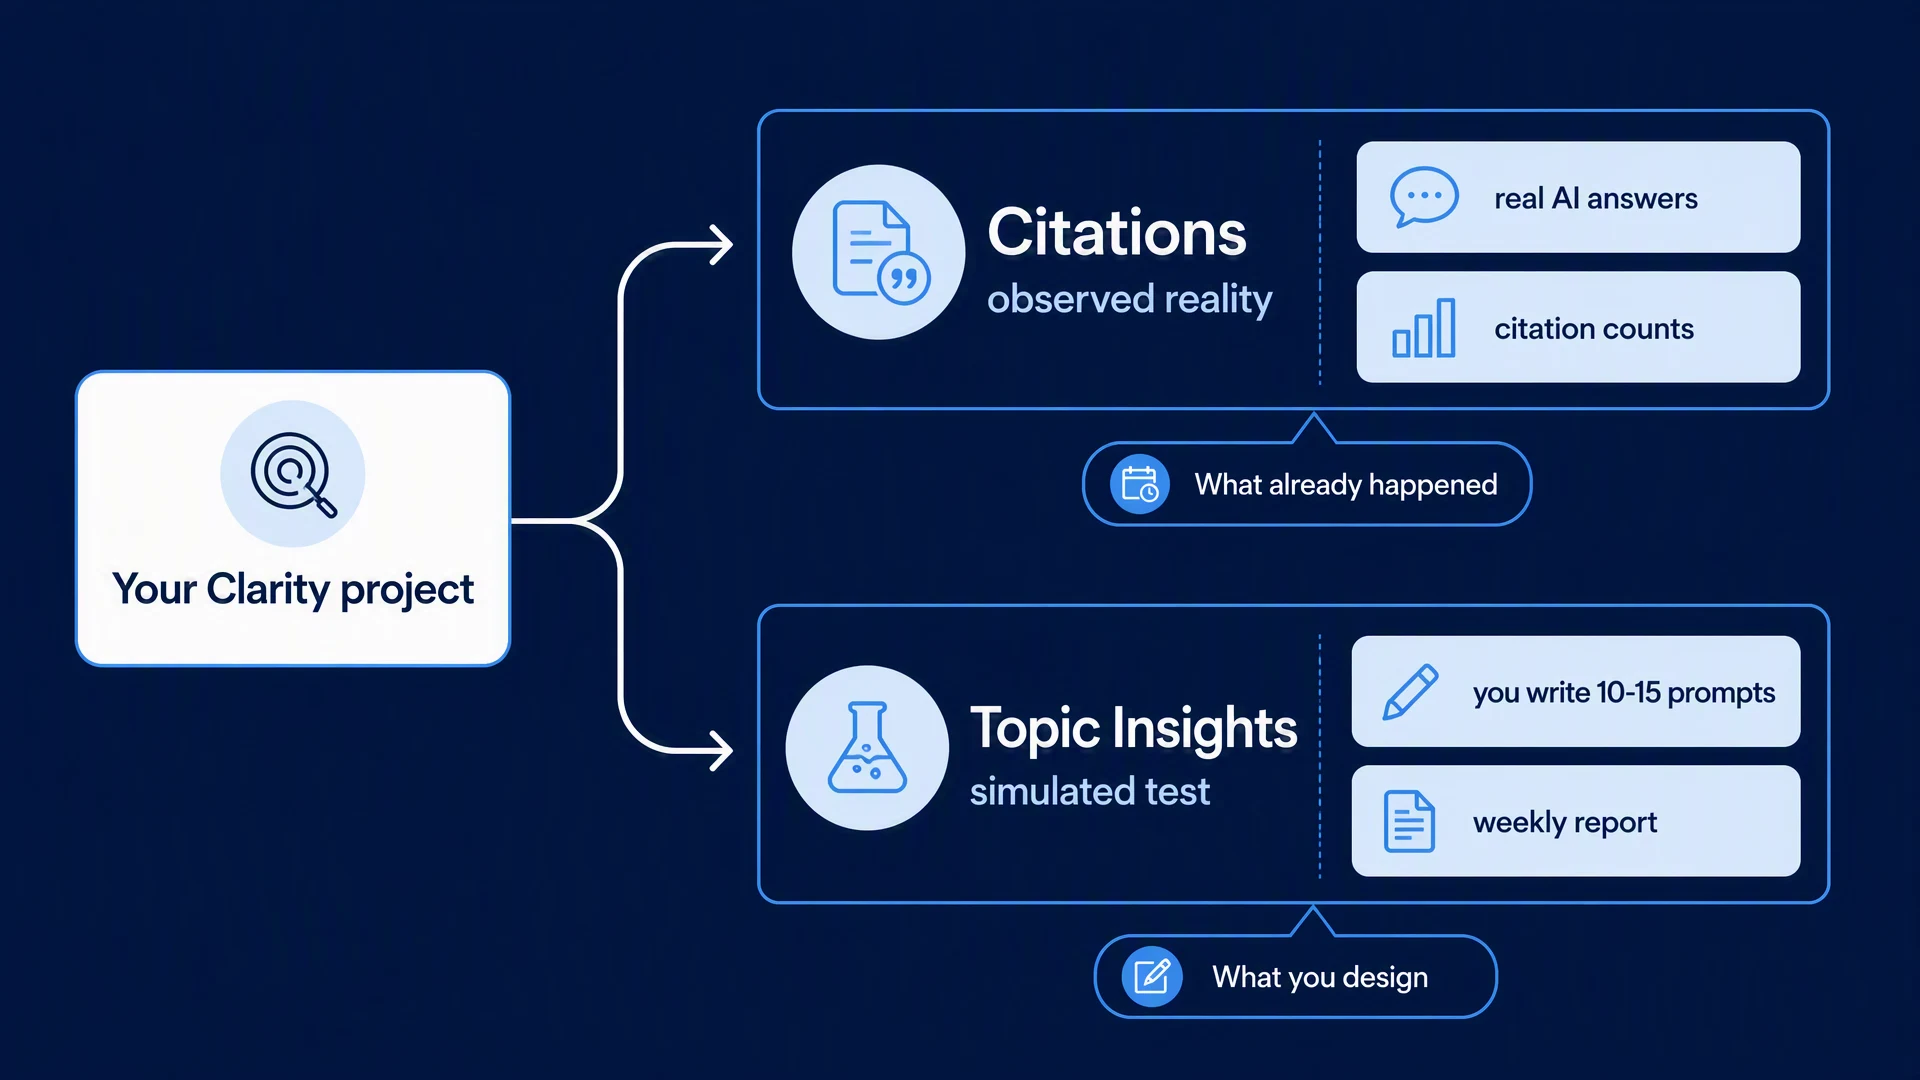
Before the glossary, one mental model that explains every other term. AI Visibility in Clarity has two dashboards.
Citations (the older one, also known as the Citation Dashboard) reports what actually happened. It shows the AI-generated answers where your pages got cited, the queries AI systems used to surface your content, and your share of citations, all from observed activity on Microsoft AI surfaces.
Topic Insights (the newer beta) runs a small simulation. You supply 10-15 prompts, Clarity generates AI answers from those prompts on a schedule, then measures how the citations split between your domain, your competitors, and everyone else.
One is a telescope pointed at the past. The other is a test you design. Both are useful; they just answer different questions.
The five columns on the Topic insights table
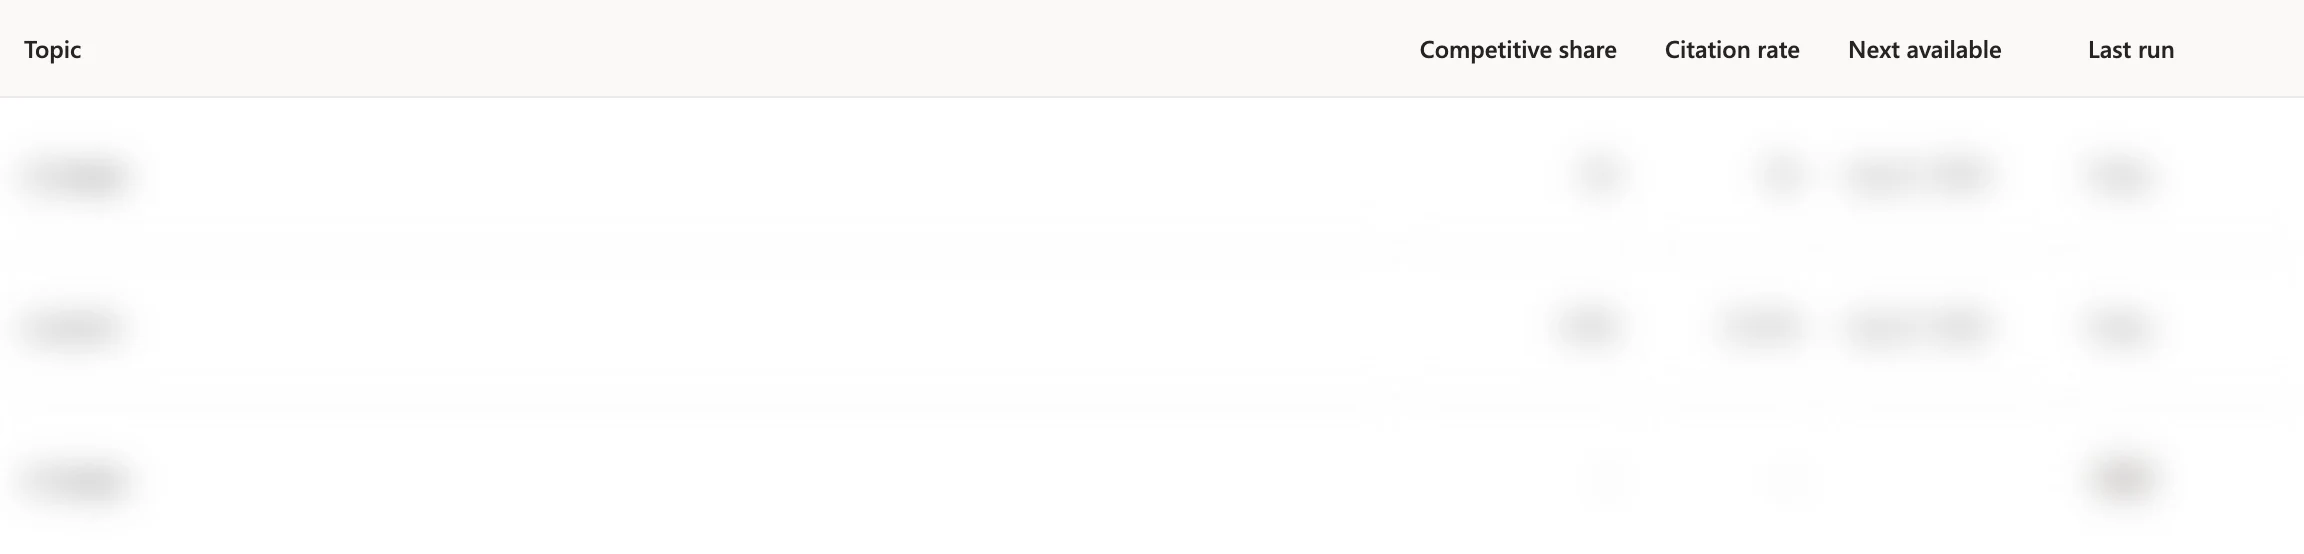
When you first land on the page, there's a table with one row per topic. Here's what each column means:
Column | What it says | What it really means |
|---|---|---|
Topic | The name you gave the group of prompts | Just a label. Clarity's own docs: the title "is only used to group prompts with a similar theme and does not affect the report or insights." |
Competitive share | Your domain's share of all page citations across the prompt set relative to your defined competitor list | The narrow version of the story: out of the domains you care about, how much is you? If you list no competitors at all, this shows as N/A. |
Citation rate | Your domain's share of all page citations across the prompt set | The wide version: out of every domain cited by the AI, how much is you? |
Next available | A date, e.g. | The next time this topic's report will run. That's the weekly automatic report, one per topic per week. |
Last run |
| When the current report was generated. |
Quick sanity check on those two share metrics: think of competitive share as "how you compare against the rivals you named" and citation rate as "how you compare against the entire open web." A site can have a high citation rate (52% of all citations for a prompt set) and a low competitive share (nine rivals with published AI-focused blogs that each beat you). The two numbers never disagree; they just use different comparison groups.
Creating a topic: every field explained
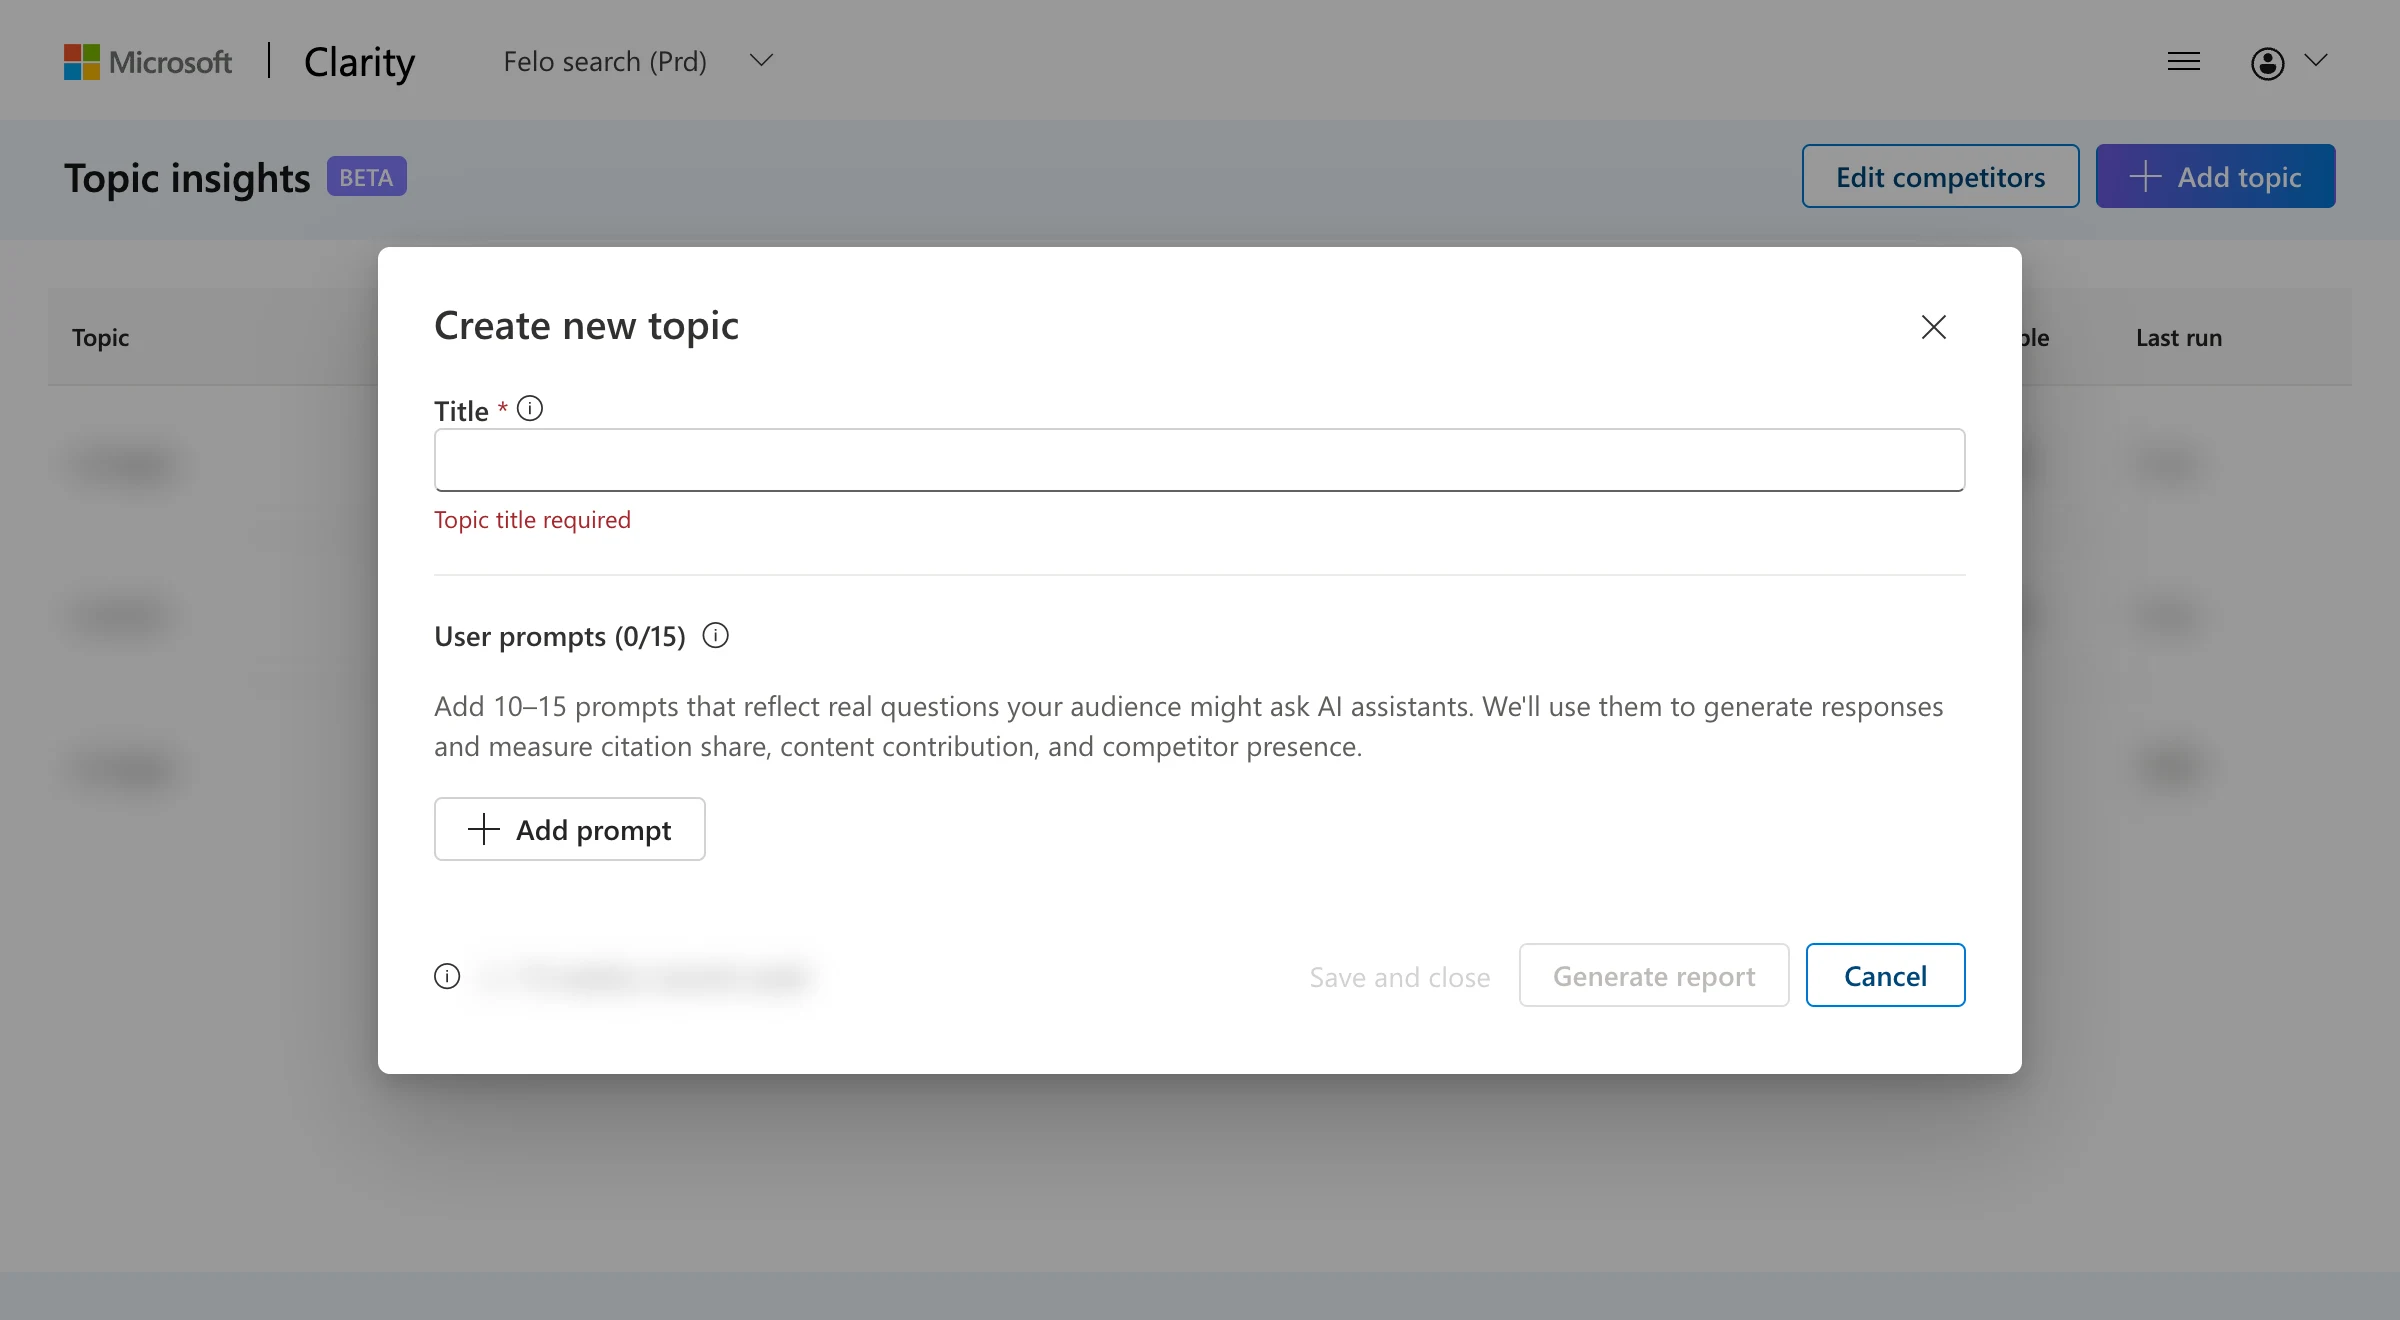
Click Add topic and a dialog called Create new topic opens. The fields, in order:
Title (required; the dialog refuses to save without one, showing a "Topic title required" message). It's cosmetic as far as data goes. Pick something short and searchable when you review your topics. "AI search tools in [your industry]" beats "red version."
User prompts (0/15). The counter runs to 15. Clarity's own text: "Add 10-15 prompts that reflect real questions your audience might ask AI assistants. We'll use them to generate responses and measure citation share, content contribution, and competitor presence."
Click Add prompt, type into the "Enter your prompts here" box, then Add (or Cancel). Write prompts exactly as a person would ask: "What should a law firm post about to get client leads?" Not "law firm content topics."
The weekly report budget. Near the bottom there's a quota counter: 2 / 10 weekly reports used. The built-in tooltip spells it out: each project gets 10 reports per week, each report analyzes a topic's 10-15 prompts, and you can generate at most one report per topic per week.
Three buttons:
- Save and close saves the topic without running a report tonight. The row shows
Draft. - Generate report runs the report now, spending one of the 10.
- Cancel throws the topic away.
What Edit competitors does
This is the box that reshapes your competitive share. The dialog's description: the domains you list are used to calculate your competitive citation share and compare authority against your defined competitors; if no competitors are added, competitive share shows as N/A; and changes apply to both upcoming and past reports.
Add the competing domains your audience would most plausibly meet in an AI answer: the ones you'd like to dethrone, not the ones you'd love to lunch with. You can always Add competitor, Remove, then Save. Note that even with a list defined, the report still surfaces outside domains in "All other," so you can't narrow reality to your competitors.
Inside a topic report: the three cards
Open a topic row and you get the detail view. The three metric cards on top carry the whole game:
Card | Microsoft's tooltip | In plain English |
|---|---|---|
Competitive share | "Displays your domain's share of all page citations across the prompt set relative to your defined competitor list." | Within the rival list: how much is you. It also shows a rank badge ("Rank #1") and citation counts. |
Citation rate | "Displays your domain's share of all page citations across the prompt set." | Within absolutely everyone: how much is you. |
Avg. answer contribution | "The average percentage of AI response content sourced from your pages." | Depth, not frequency. A site cited once for an entire answer scores higher here than one cited ten times for a single sentence. |
That last one is the metric most people skip and shouldn't. Being the cited source is different from being a cited source. Contribution is how strongly the AI leans on your content.
Share of authority: the two levels
Further down, the report breaks authority down twice.
Share of authority (SoA): the classic citation share, calculated per day over the report window (your citations ÷ all citations from all domains). The list is sorted by domain, each row labeled You or Other, with a percentage and a raw citation count, plus an All other domains row that groups the tail.
Share of authority by category is the same math in three buckets: You, Other, and Competitor. This strip is the one to watch. Competitor 0% with a large Other bucket doesn't mean nobody competes for your topic; it means the domains cited aren't in your defined list, and your competitive share story needs a better competitor set.
One caveat from Microsoft's own docs: share of authority is calculated daily and only includes days where your site was cited. It's a directional trend, not an exact market-share number.
Top content opportunities and Your top content to AI responses
The two insight panels at the bottom are the actual homework:
- Top content opportunities, labeled "How other sources are used in responses." It expands into insight items, each with a Covered by list of domains: the sites currently winning a subtopic where you aren't cited. Treat each item as a mini content brief, because that's a query family worth writing for.
- Your top content to AI responses, labeled "How your top pages contribute to the responses." Each item shows Covered in plus links to the actual pages being cited (a "+ N more" link when the list is long). This is the evidence your docs and FAQ pages are working.
Both panels are AI-generated summaries. Clarity puts the warning right on the page: "Your insights are powered by AI, so mistakes are possible." Use them as starting points, not as conclusions.
The prompts view, and history
From the detail view, More actions has two items:
- View user prompts opens a side panel splitting the topic's prompts into Cited and Not cited lists. This is your gap list in its rawest form: the exact questions where the AI answers didn't bring you in.
- View history lists past reports, each card showing the date, competitive share, citation rate, and the model that generated it (the label reads "AI model: GPT 5.3"). You can jump between runs with the Previous/Next run buttons, and there's a Generate new report button that spends one of the weekly budget.
Anything else on the page is chrome: Back to topics, Edit topic, and Filters. On the Citations dashboard the filters let you narrow by time frame, by branded or non-branded queries, and by specific query text or URLs.
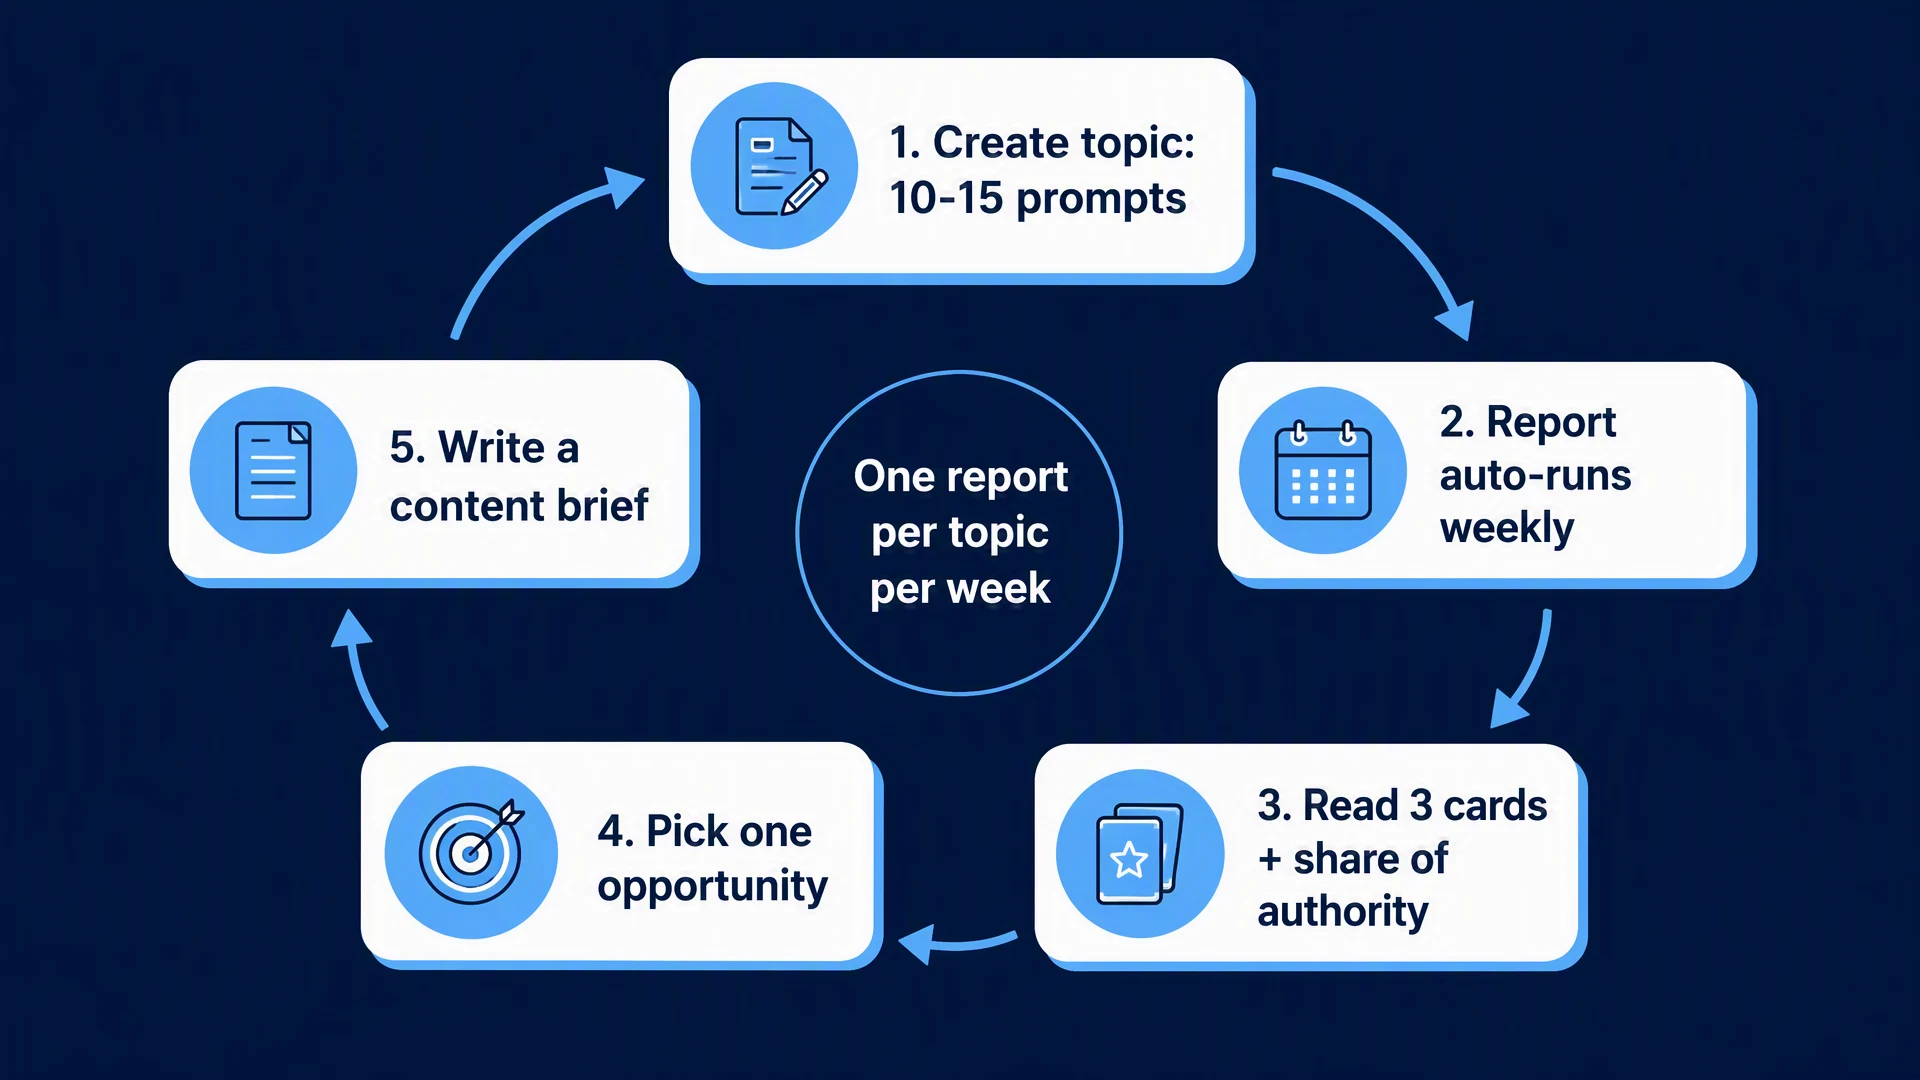
A 30-minute walkthrough: first topic, first report
- List 12 real questions. Borrow from support tickets, the gap list in your Citations dashboard, and your sales calls. Aim for the mix that covers "what is X," "how to X," and "X vs Y."
- Prepare the audience story before you type. Write prompts the way customers phrase them, not the way your product page does. If it reads like a keyword list, rephrase it as a sentence you'd honestly type into an AI chat.
- Add the topic with 12 of those prompts. Title it, paste the prompts one by one, and when the counter shows 12/15, click Generate report (or Save and close for a draft and let the weekly run do it).
- Edit competitors. Load in the three to seven domains whose AI presence actually threatens yours.
- Give it a week if you can. One run on a quiet day can mislead you; the weekly bot run feels more representative. Then read the three cards, the two SoA views, and the two insight panels, and pick one opportunity item as next quarter's editorial hole.
Reading the numbers: a worked example
Warning: every figure below is an invented illustration, not real data. Any resemblance to your dashboard is a coincidence.
Imagine you run a productivity-software site, and your topic is "AI note-taking apps."
Signal | Illustrative value | What it implies |
|---|---|---|
Citation rate | 18% | Citable. Of all domains cited for this prompt set, about one in five references is yours. |
Competitive share | 41% (Rank #1) | Among the four domains you named as rivals, you lead. |
Avg. answer contribution | 32% | When cited, the AI actually pulls a third of its content from you. You're a source, not a footnote. |
SoA: You vs Other | You 18% / All other 54% | Three quarters of the answer space is dominated by unnamed domains. That's ordinary: this topic is contested. |
Top opportunities | "Comparison tables" (Covered by 6 domains) | Nobody's winning comparisons via you. That's the brief: a real comparison page with hands-on data. |
Two healthy-skeptic checks before you write anything. A single run on a Sunday night might show 0% competitive share even though you're cited all week; the input is a small set of prompts, and this is a sample, not a census. And per Microsoft's own notice, the data "represents a sample of overall activity" and may be "refined as additional data is processed."
Limits worth knowing
- It's a simulation, not a mirror. Topic Insights asks an AI model to answer your prompts. It doesn't observe what ChatGPT, Gemini, or Perplexity actually show users. Clarity's Citation dashboard is the observed-data side; Topics is the designed-test side.
- The quotas are firm. 10 reports per project per week, 10-15 prompts per topic. Stop at 3-4 topics; fat reports are click-only entertainment.
- Absence shows up as 0, not as a question mark. With observed data, if you're never cited for a prompt, Clarity can't tell you that. No citation, no data. With Topic Insights you'll see the zero, but you won't see a report about a topic you never drafted.
- Blank cells are states, not errors.
--with aDrafttag means the report hasn't run. N/A under competitive share means no competitors are defined. Neither is a problem; they're just nothing yet.
Quick checklist
- [ ] Domain verified in Clarity, and AI Visibility visible in the project
- [ ] One topic with 10-15 customer-phrased prompts
- [ ] Three to seven competitors added in Edit competitors
- [ ] First report generated (or saved as Draft for the weekly run)
- [ ] Read: 3 cards, 2 SoA views, both insight panels
- [ ] One opportunity item picked as a content brief
- [ ] Weekly calendar reminder (one report per topic per week, 10-report budget)
FAQ
Is Topic Insights free? Yes. Clarity's AI Visibility features are free to all Clarity users, with no paid plan. The real limits are the weekly report budget and the number of topics you can cover.
Which AI model answers the prompts? At the time of writing, the report card shows "AI model: GPT 5.3," and Microsoft's announcement describes the feature as using a live model grounded in web search. The label is printed on every history card, so you can always see what generated a given report.
Does it track ChatGPT, Perplexity, or Google's AI Overviews? Not as observed reality. The results come from the simulation Clarity runs against its own pipeline, and the observed Citations dashboard is similarly scoped to Microsoft AI surfaces. For a cross-check of how the major assistants surface your domain, run an independent visibility check, e.g. Auspia's AI Search Visibility Checker, across the main assistants.
Why is my competitive share 0%? Either your site wasn't cited in any answers in that run (a small prompt set can snowball into big-looking zeros), or your competitor list needs a refresh: add the domains that actually appear in the answers under "All other." 0% is a prompt-design problem as often as it is a content problem.
Can I run a report any time? You can run one per topic per week, out of the ten weekly for the project. The Next available column and the disabled Generate new report button are volume discipline: they don't want you burning all ten on Monday.
Should I check every week? Yes, but treat three months of reports as a trend, not a mood check. Weekly run, monthly review.
Author: Alice Monroe, AI SEO Tools Analyst Covering 150+ Tools at Auspia. Alice writes about AI SEO tooling, benchmarks, and how growth teams pick and use the right AI visibility stack.