

Short answer: Topic Insights आपको क्या देता है
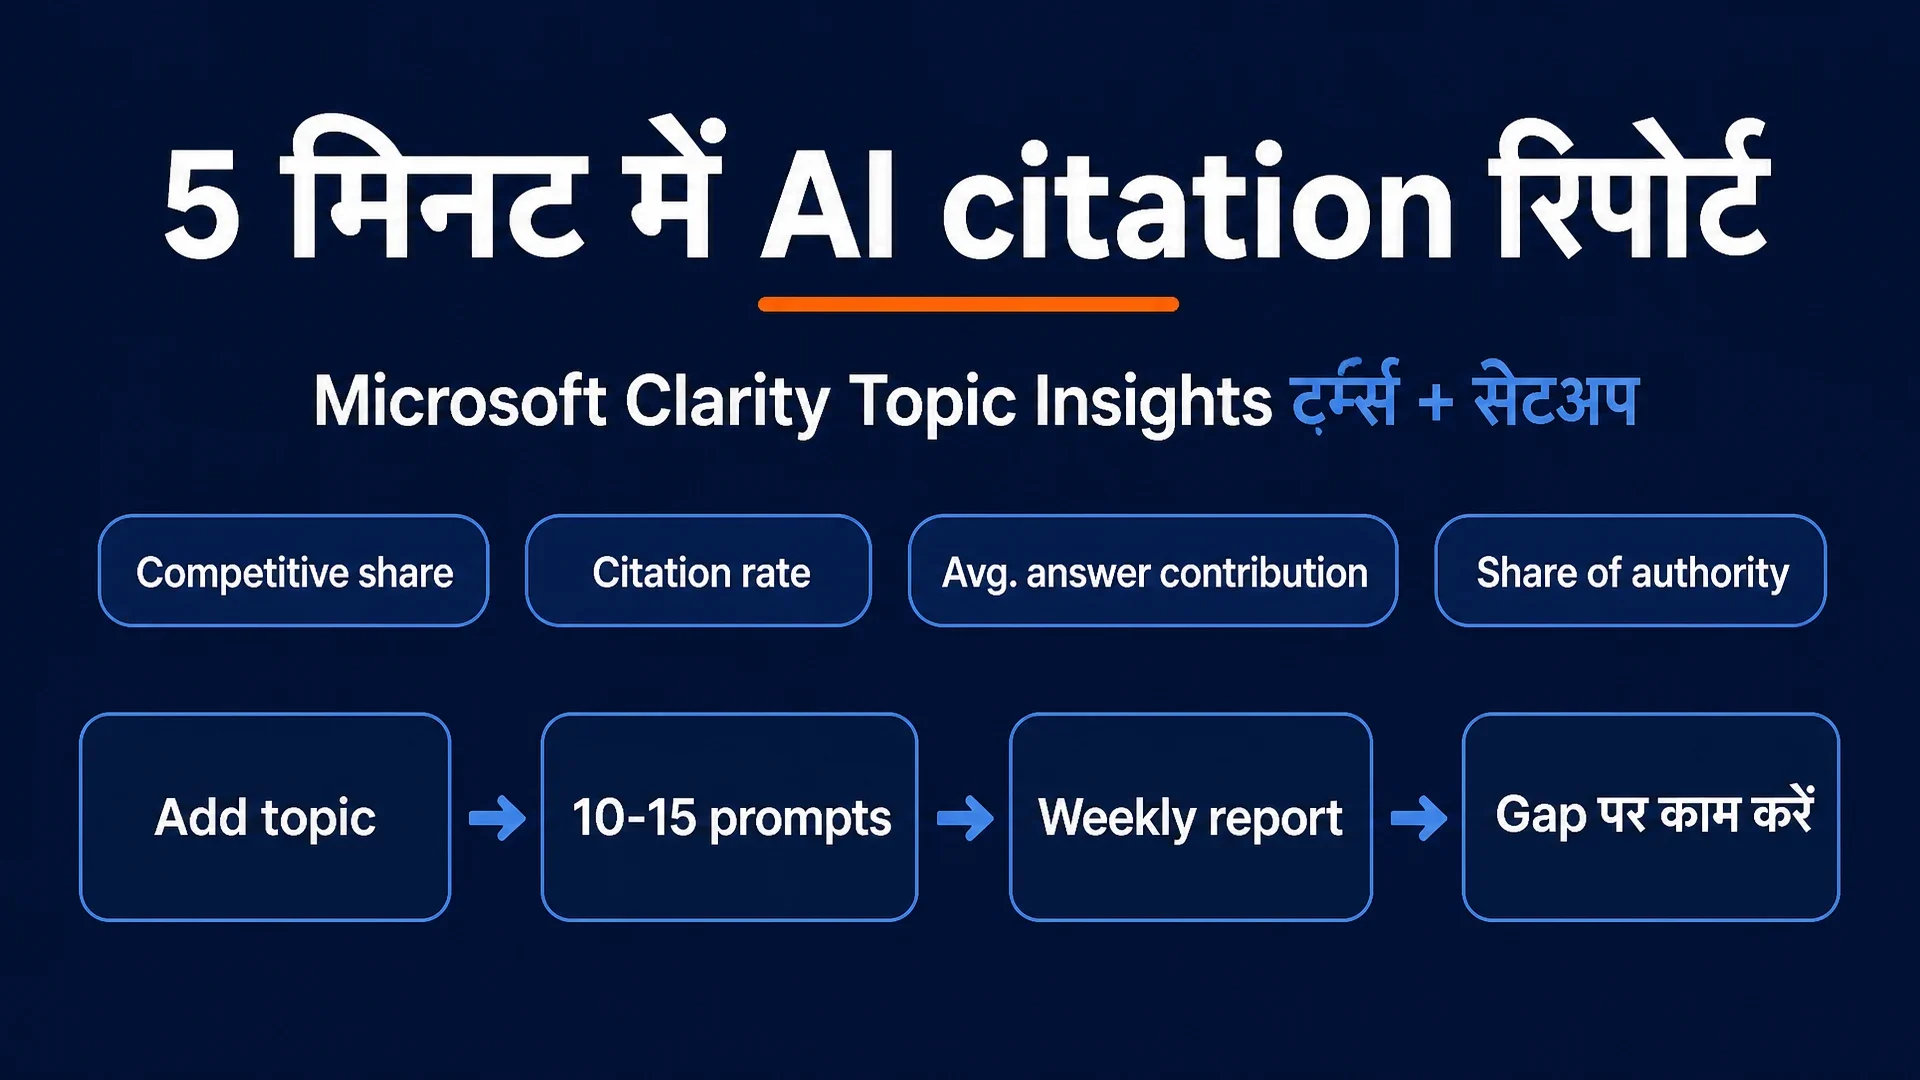
Microsoft Clarity का Topic Insights (यह AI Visibility का हिस्सा है, अभी beta में) उन सवालों की सूची लेता है जो आप लिखते हैं, यानी ऐसे सवाल जो आपका audience सच में किसी AI assistant से पूछेगा, उन्हें एक live AI model से चलाता है और बताता है कि जवाबों में किस domain को cite किया गया। रिपोर्ट एक साथ तीन बातें बताती है: आपकी site कितनी बार दिखती है, आप बातचीत में आगे हैं या सिर्फ mention होते हैं, और कौन से subtopics दूसरे domains ऐसे इस्तेमाल कर रहे हैं जहाँ आप नहीं हैं।
यह guide वह text है जो आप चाहते थे कि स्क्रीन के साथ हो: page के हर label और tooltip का असली मतलब, और उसे पढ़ने के बाद क्या करना चाहिए। अंत तक आपको पता होगा कि क्या click करना है, अच्छा score कैसा दिखता है और कब कोई number बेकार है।
- यह किसके लिए है: कोई भी site owner जिसके पास Microsoft account है और site पर Clarity का tracking code लगा है। कोई paid plan नहीं चाहिए, कोई AI-search toolkit की license नहीं।
- अंत में आपको क्या मिलेगा: एक topic तय, उसकी पहली report तैयार और content gaps की एक छोटी list जो लिखने लायक हैं।
- समय: setup में लगभग 30 मिनट, फिर हफ्ते में एक बार review।
- कब काम पूरा: जब आपने एक report पढ़ी और "Top content opportunities" की एक item पर काम करने का फैसला किया।
AI Visibility के अंदर की दो dashboards
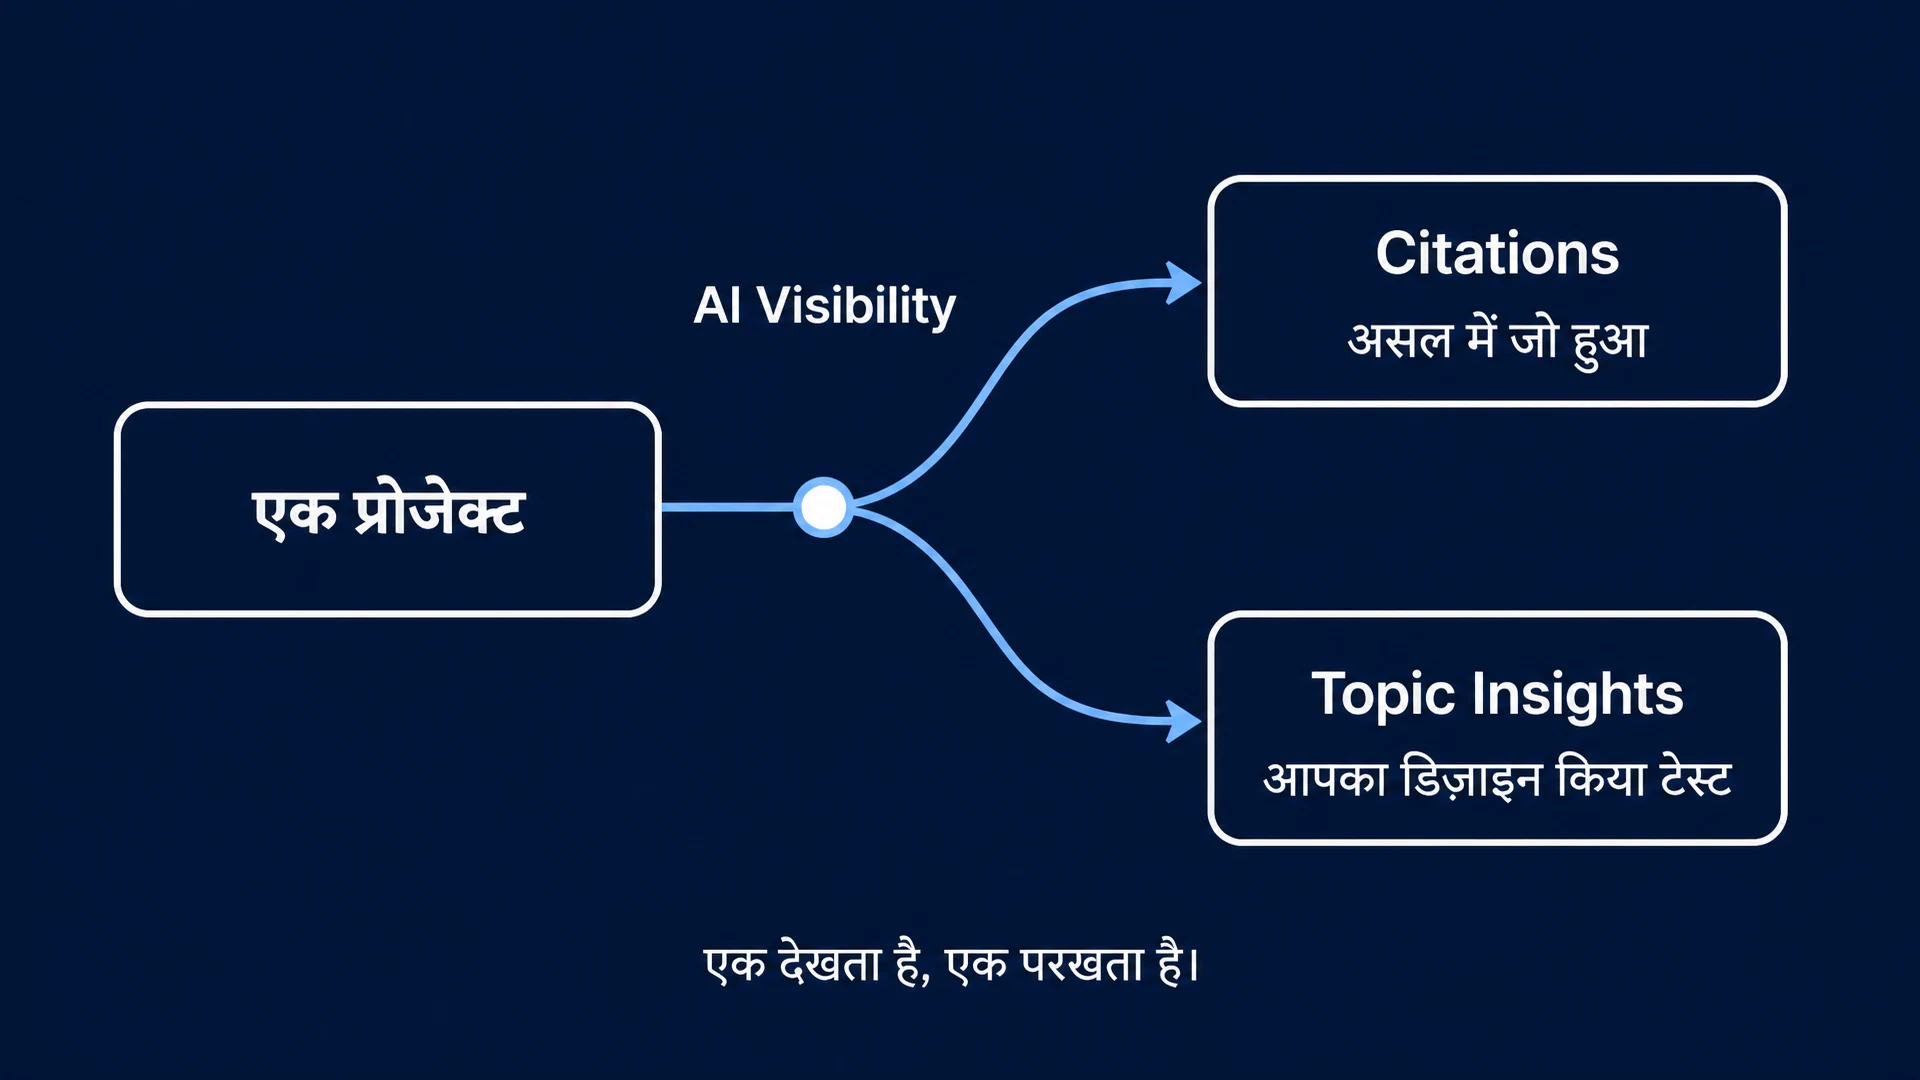
Glossary शुरू होने से पहले, एक mental model जो बाकी सब terms को समझाती है। Clarity के AI Visibility में दो dashboards हैं।
Citations (पुराना, साथ ही Citation Dashboard के नाम से भी जाना जाता है) वह बताता है जो वाकई हुआ। यह उन AI-generated जवाबों को दिखाता है जहाँ आपके pages cite हुए, उन queries को जिनसे आपका content सामने आया और आपके citations का हिस्सा। यह सब Microsoft की AI सतहों पर देखी गई असल गतिविधि से आता है।
Topic Insights (नया beta) एक छोटा simulation चलाता है। आप 10-15 prompts देते हैं, Clarity एक शेड्यूल पर उन prompts के AI जवाब बनाता है, फिर मापता है कि citations आपके domain, आपके competitors और बाकी सबके बीच कैसे बँटे।
पहला telescope है जो past की ओर देखता है। दूसरा वह test है जो आप खुद design करते हैं। दोनों उपयोगी हैं; बस दोनों अलग-अलग सवालों का जवाब देते हैं।
Topic insights table के पाँच columns
Page पर पहली बार पहुँचते हैं तो एक table दिखती है जिसमें हर topic की एक row होती है। हर column का मतलब यह है:
Column | यह क्या बताता है | असल में इसका मतलब |
|---|---|---|
Topic | आपने इस prompts के समूह को जो नाम दिया | सिर्फ एक label। Clarity की अपनी docs: यह title "is only used to group prompts with a similar theme and does not affect the report or insights" यानी सिर्फ मिलते-जुलते theme वाले prompts को एक समूह में रखने के काम आती है; report या insights पर कोई असर नहीं डालती। |
Competitive share | आपकी परिभाषित competitor list की तुलना में पूरे prompt set की सारी page citations में आपके domain का हिस्सा | कहानी का छोटा version: जिन domains की आप परवाह करते हैं, उनमें से कितना हिस्सा आप हैं? अगर आप कोई competitor नहीं जोड़ते तो यह N/A दिखता है। |
Citation rate | पूरे prompt set की सारी page citations में आपके domain का हिस्सा | कहानी का बड़ा version: AI द्वारा cite किए गए हर domain में से कितना आप हैं? |
Next available | एक date, जैसे | यह topic की report अगली बार कब चलेगी। वही हफ्ते वाला automatic report है, हर topic की हफ्ते में एक। |
Last run |
| मौजूदा report कब बनी। |
उन दोनों share metrics पर एक quick sanity check: competitive share को ऐसे सोचें कि "आप अपने नाम किए rivals के मुकाबले कैसे हैं" और citation rate को "आप पूरी खुली दुनिया के मुकाबले कैसे हैं।" किसी site का citation rate काफी ऊँचा हो सकता है (एक prompt set की सारी citations का 52%) और competitive share कम (नौ rivals जिनके published AI-focused blogs आपसे आगे निकले)। दोनों numbers कभी नहीं झगड़ते; बस दोनों के तुलना के group अलग हैं।
Creating a topic: हर field का मतलब
Add topic click करें तो Create new topic नाम का dialog खुलता है। Fields, इसी क्रम में:
Title (ज़रूरी; इसके बिना dialog save नहीं करता, "Topic title required" message दिखाता है)। Data के लिहाज़ से यह सजावटी है। कुछ छोटा और search करने लायक नाम रखिए ताकि topics का review करते शामिल हो। "AI search tools in [आपका industry]" जैसा नाम "red version" से बेहतर है।
User prompts (0/15). Counter 15 तक जाता है। Clarity का अपना text: "ऐसे 10-15 prompts जोड़ें जो सच में उन सवालों की तरह हों जो आपका audience AI assistants से पूछ सकता है। हम इनका इस्तेमाल जवाब बनाने और citation share, content contribution तथा competitor presence मापने के लिए करेंगे।"
Add prompt click करें, "Enter your prompts here" box में टाइप करें, फिर Add (या Cancel)। Prompts बिल्कुल वैसे लिखें जैसे एक इंसान असल में पूछता है: "Law firm को client leads कैसे मिलेंगे, इसके लिए क्या post करे?" वैसा भी न लिखें: "law firm content topics।"
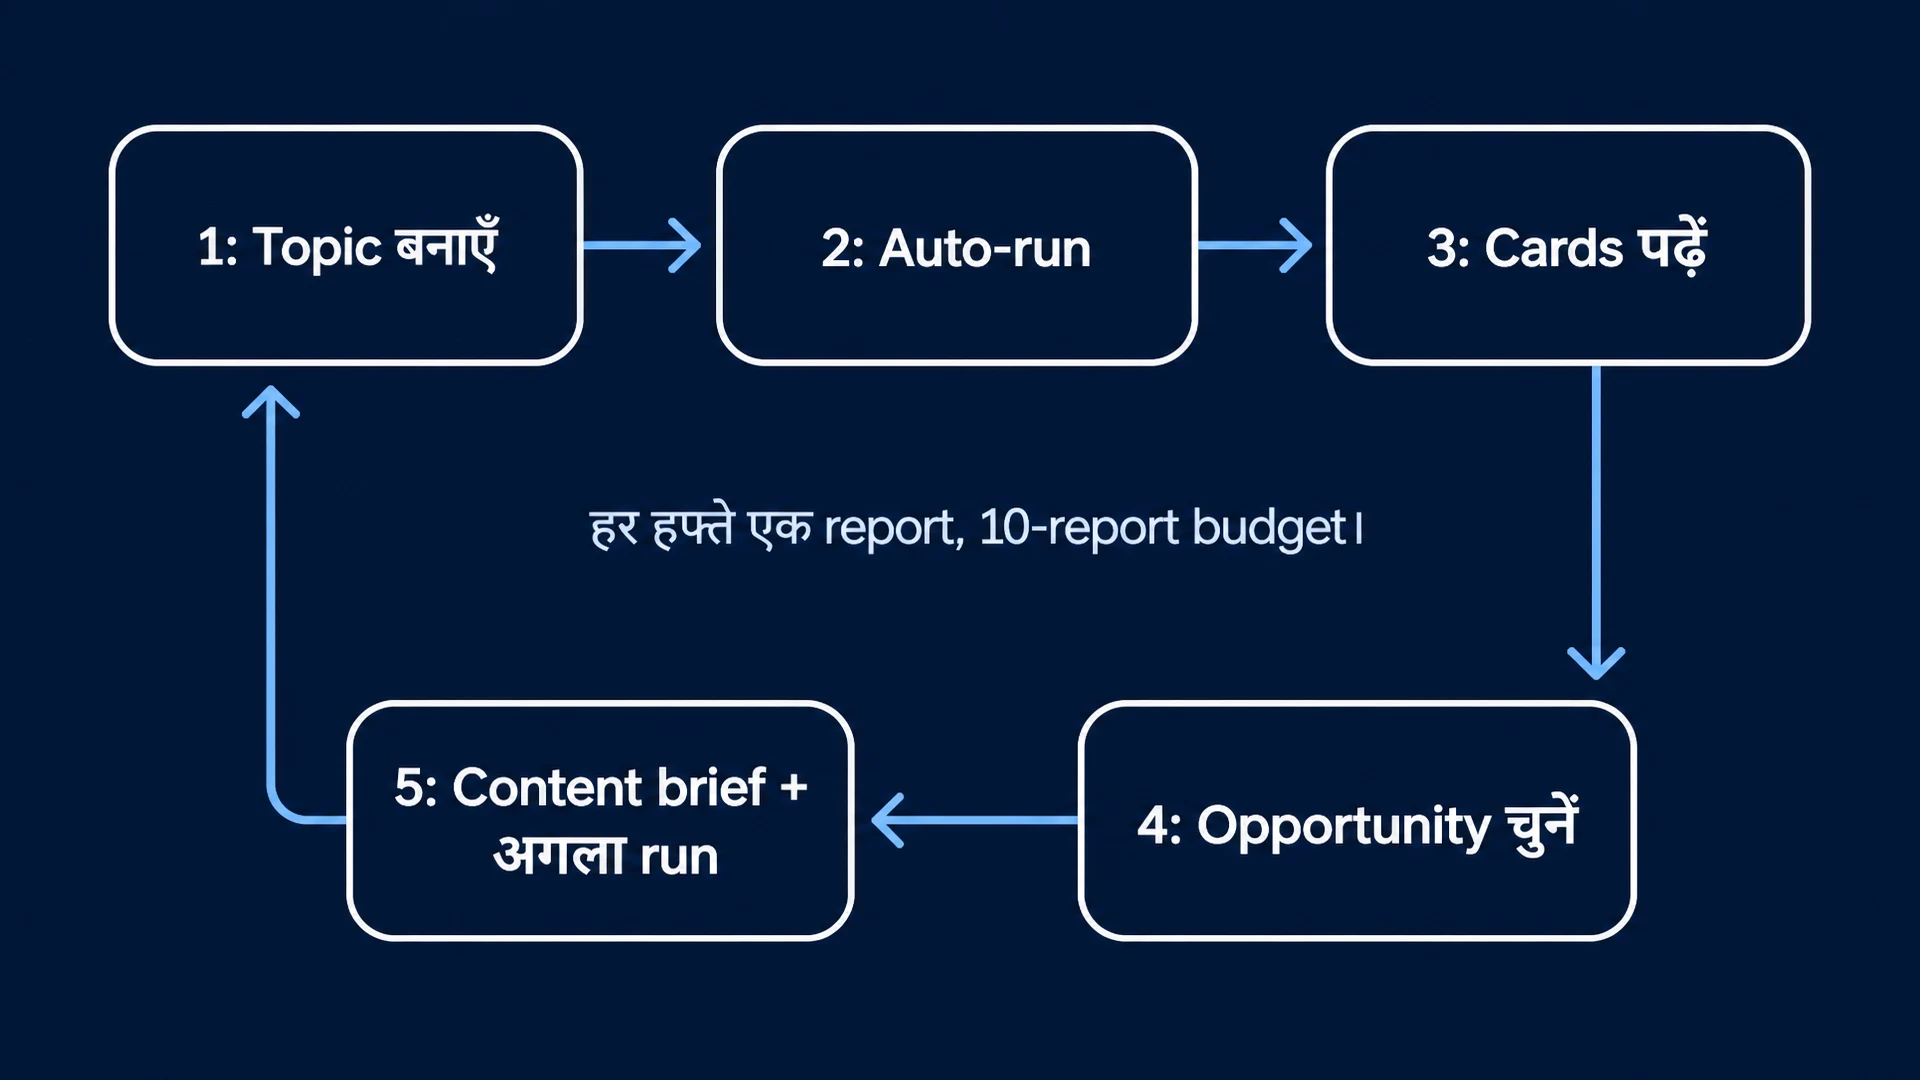
The weekly report budget. नीचे एक quota counter है: 2 / 10 weekly reports used। Built-in tooltip यही बताता है: हर project को हफ्ते में 10 reports मिलती हैं, हर report किसी एक topic के 10-15 prompts का विश्लेषण करती है, और आप हर topic की हफ्ते में अधिकतम एक report बना सकते हैं।
तीन buttons:
- Save and close topic को बिना report चलाए save कर देता है। Row में
Draftदिखता है। - Generate report अभी report चला देता है, यानी 10 में से एक खर्च होती है।
- Cancel topic को पूरी तरह छोड़ देता है।
What Edit competitors does
यही box आपके competitive share की तस्वीर बदलता है। Dialog का description: आप जो domains सूची में डालते हैं वे आपका competitive citation share निकालने और परिभाषित competitors के मुकाबले authority तुलना के लिए इस्तेमाल होते हैं; अगर कोई competitor नहीं जोड़ा तो competitive share N/A दिखता है; और ये बदलाव आने वाली और पिछली दोनों reports पर लागू होते हैं।
वे competing domains जोड़ें जिन्हें आपका audience किसी AI के जवाब में सबसे ज़्यादा मुमकिन मिले: जिन्हें आप गद्दी से उतारना चाहते हैं, न कि जिनके साथ lunch करना चाहें। आप कभी भी Add competitor, फिर Remove करके Save कर सकते हैं। ध्यान रखिए कि list तय होने के बाद भी report बाहर के domains को "All other" में दिखाती रहती है, यानी आप reality को सिर्फ अपने competitors तक सीमित नहीं कर सकते।
Inside a topic report: तीन cards
Topic की row खोलिए तो detail view मिलता है। ऊपर के तीन metric cards पूरा खेल चलाते हैं:
Card | Microsoft का tooltip | सीधी हिंदी में |
|---|---|---|
Competitive share | "आपकी परिभाषित competitor list की तुलना में पूरे prompt set की सारी page citations में आपके domain का हिस्सा दिखाता है।" | Rival list के भीतर: कितना आप हैं। साथ में rank badge ("Rank #1") और citation counts भी दिखते हैं। |
Citation rate | "पूरे prompt set की सारी page citations में आपके domain का हिस्सा दिखाता है।" | वाकई सबके भीतर: कितना आप हैं। |
Avg. answer contribution | "AI जवाब के content का औसत प्रतिशत जो आपके pages से आया है।" | Depth, frequency नहीं। जो site पूरे जवाब के बदले एक बार cite हुई, वह उस site से ऊँचा score पाती है जो एक ही वाक्य के बदले दस बार cite हुई। |
यह आखिरी metric सबसे ज़्यादा लोग skip करते हैं, और नहीं करना चाहिए। The cited source होना अलग चीज़ है a cited source होने से। Contribution बताता है कि AI आपके content पर कितना झुकता है।
Share of authority: दो levels
नीचे आते-आते report authority को दो बार तोड़ती है।
Share of authority (SoA): classic citation share, report window के दौरान हर दिन का हिसाब (आपके citations ÷ सभी domains के सारे citations)। List domain के हिसाब से sort है, हर row पर You या Other का label, एक percentage और raw citation count, साथ में All other domains की row जो बाकी सब को जोड़ती है।
Share of authority by category वही गणित तीन buckets में: You, Other और Competitor। यह strip देखने वाली है। Competitor 0% और बड़ा Other bucket का मतलब यह नहीं कि आपके topic पर कोई मुकाबला नहीं; मतलब यह है कि जो domains cite हुए वे आपकी सूची में नहीं हैं, और आपकी competitive share की कहानी के लिए बेहतर competitor set चाहिए।
Microsoft की अपनी docs से एक सावधानी: share of authority हर दिन calculate होता है और सिर्फ उन दिनों को शामिल करता है जब आपकी site cite हुई। यह दिशा का trend है, एकदम सटीक market-share number नहीं।
Top content opportunities और Your top content to AI responses
नीचे के दो insight panels ही असली homework हैं:
- Top content opportunities, label है "How other sources are used in responses"। यह insight items में खुलता है, हर item के साथ Covered by की domains list: वे sites जो अभी उस subtopic पर जीत रही हैं जहाँ आप cite नहीं हुए। हर item को एक छोटा content brief मानिए, क्योंकि यह वह query family है जिसके लिए लिखना चाहिए।
- Your top content to AI responses, label है "How your top pages contribute to the responses"। हर item में Covered in और उन असली pages के links दिखते हैं जो cite हो रहे हैं (लंबी list हो तो "+ N more" link)। यही सबूत है कि आपके docs और FAQ pages काम कर रहे हैं।
दोनों panels AI-generated summaries हैं। Clarity चेतावनी page पर ही छापता है: "आपके insights AI से बने हैं, इसलिए गलतियाँ संभव हैं।" इन्हें शुरुआत का बिंदु मानिए, निष्कर्ष नहीं।
The prompts view, और history
Detail view से, More actions में दो items:
- View user prompts एक side panel खोलता है जो topic के prompts को Cited और Not cited lists में बाँटता है। यही आपकी gap list का सबसे कच्चा रूप है: वे सटीक सवाल जिनके AI जवाबों में आप जगह नहीं पाए।
- View history पिछली reports की list दिखाता है, हर card में date, competitive share, citation rate और वह model जिसने report बनाई (label है "AI model: GPT 5.3")। Previous/Next run buttons से runs के बीच जा सकते हैं, और वहाँ एक Generate new report button भी है जो weekly budget में से एक खर्च करता है।
Page की बाकी बची हर चीज़ chrome है: Back to topics, Edit topic और Filters। Citations dashboard पर Filters आपको time frame, branded या non-branded queries और खास query text या URLs से narrow करने देते हैं।
A 30-minute walkthrough: पहला topic, पहली report
- 12 असली सवालों की list बनाइए। Support tickets से, Citations dashboard की gap list से और अपनी sales calls से उधार लीजिए। ऐसा मिश्रण चाहिए जो "what is X," "how to X" और "X vs Y" तीनों को कवर करे।
- टाइप करने से पहले audience की कहानी तैयार कीजिए। Prompts वैसे लिखिए जैसे customer कहता है, न कि जैसे आपका product page कहता है। अगर वह keyword list जैसा पढ़ा जाए, तो उसे उस sentence में बदलिए जो आप सच में किसी AI chat में टाइप करते।
- उन 12 में से prompts के साथ topic जोड़िए। Title दीजिए, prompts एक-एक करके paste कीजिए, और जब counter 12/15 दिखाए तो Generate report click कीजिए (या draft के लिए Save and close, और बाकी काम weekly run संभाल लेगी)।
- Edit competitors। उन तीन से सात domains डालिए जिनकी AI उपस्थिति सच में आपकी उपस्थिति को खतरा देती है।
- हो सके तो एक हफ्ता कीजिए। शांत दिन की एक run गुमराह कर सकती है; weekly bot run ज़्यादा प्रतिनिधि लगती है। फिर तीनों cards, दोनों SoA views और दोनों insight panels पढ़िए, और एक opportunity item चुनिए जो अगले quarter का editorial hole हो।
Reading the numbers: एक worked example
Warning: नीचे का हर आंकड़ा एक गढ़ा हुआ उदाहरण है, असली data नहीं। आपके dashboard से कोई भी मिलान संयोग है।
मान लीजिए आप एक productivity-software site चलाते हैं, और आपका topic है "AI note-taking apps"।
Signal | उदाहरण स्थिति | इसका क्या मतलब |
|---|---|---|
Citation rate | 18% | Cite होने लायक। इस prompt set के सारे cited domains में से करीब हर पाँचवाँ reference आपका है। |
Competitive share | 41% (Rank #1) | जिन चार domains को आपने rivals नाम किया, उनमें आप आगे हैं। |
Avg. answer contribution | 32% | जब cite होते हैं तो AI सच में अपना एक तिहाई content आपसे लेता है। आप source हैं, footnote नहीं। |
SoA: You vs Other | You 18% / All other 54% | जवाब की जगह का तीन चौथाई हिस्सा बेनाम domains का है। यह साधारण है: इस topic पर मुकाबला है। |
Top opportunities | "Comparison tables" (Covered by 6 domains) | कोई भी आपके जरिए comparisons नहीं जीत रहा। वही brief है: hands-on data वाला एक असली comparison page। |
लिखने से पहले दो healthy-skeptic जाँचें। एक Sunday रात की अकेली run शायद 0% competitive share दिखाए, जबकि पूरे हफ्ते आप cite होते रहे; input prompts का छोटा set है, और यह एक sample है, census नहीं। और Microsoft के अपने नोटिस के अनुसार, data "समग्र गतिविधि का एक sample है" और जैसे-जैसे और data process होता है, "परिष्कृत" हो सकता है।
Limits worth knowing
- यह simulation है, आईना नहीं। Topic Insights एक AI model से आपके prompts का जवाब पूछता है। यह नहीं देखता कि ChatGPT, Gemini या Perplexity लोगों को असल में क्या दिखाते हैं। Clarity का Citation dashboard observed-data वाला पक्ष है; Topics designed-test वाला पक्ष।
- Quotas पक्के हैं। हर project की हफ्ते में 10 reports, हर topic के 10-15 prompts। 3-4 topics पर रुकिए; मोटी-मोटी reports सिर्फ click करने का मनोरंजन होती हैं।
- अनुपस्थिति 0 के रूप में दिखती है, सवाल के रूप में नहीं। Observed data में, अगर आप किसी prompt के लिए कभी cite नहीं हुए, तो Clarity आपको यह बता ही नहीं सकता। No citation, no data। Topic Insights में आप वह zero देखेंगे, पर ऐसे topic की report नहीं देखेंगे जिसे कभी draft ही नहीं किया।
- खाली cells states हैं, errors नहीं।
--के साथDrafttag का मतलब report चली नहीं। Competitive share के नीचे N/A का मतलब कोई competitor define नहीं। दोनों में कोई समस्या नहीं; वे अभी कुछ नहीं हैं।
Quick checklist
- [ ] Clarity में domain verified, और project में AI Visibility दिख रहा है
- [ ] 10-15 customer-style prompts वाला एक topic
- [ ] Edit competitors में तीन से सात competitors जोड़े
- [ ] पहली report generate की (या weekly run के लिए Draft में saved)
- [ ] पढ़ा: 3 cards, 2 SoA views, दोनों insight panels
- [ ] एक opportunity item को content brief की तरह चुना
- [ ] Weekly calendar reminder (हर topic की हफ्ते में एक report, 10-report budget)
FAQ
क्या Topic Insights free है? हाँ। Clarity की AI Visibility features सभी Clarity users के लिए free हैं, कोई paid plan नहीं। असली सीमाएँ weekly report budget और आपके cover किए topics की संख्या हैं।
इन prompts का जवाब कौन सा AI model देता है? लिखे जाने के समय, report card पर "AI model: GPT 5.3" छपा है, और Microsoft की announcement इस feature को web search पर grounded live model इस्तेमाल करता हुआ describe करती है। यह label हर history card पर छपा होता है, इसलिए किसी report को किसने बनाई, यह हमेशा देखा जा सकता है।
क्या यह ChatGPT, Perplexity या Google's AI Overviews को track करता है? Observed reality की तरह नहीं। नतीजे उस simulation से आते हैं जिसे Clarity अपनी खुद की pipeline पर चलाता है, और observed Citations dashboard भी वैसे ही Microsoft AI surfaces तक सीमित है। यह जाँचने के लिए कि बड़े assistants आपका domain कैसे सामने लाते हैं, एक independent visibility check चलाइए, जैसे Auspia का AI Search Visibility Checker, मुख्य assistants पर।
मेरा competitive share 0% क्यों है? या तो उस run में आपकी site किसी जवाब में cite नहीं हुई (prompts का छोटा set बड़े दिखने वाले zeros में बदल सकता है), या आपकी competitor list को refresh चाहिए: जो domains "All other" में असल में दिखते हैं उन्हें जोड़िए। 0% जितनी बार content की समस्या है उतनी ही बार prompt-design की समस्या है।
क्या मैं report कभी भी चला सकता हूँ? आप हर topic की हफ्ते में एक report चला सकते हैं, project की साप्ताहिक दस में से। Next available column और disabled Generate new report button यही discipline समझाते हैं: वे नहीं चाहते कि सोमवार को ही आप दसों जला दें।
क्या मुझे हर हफ्ते जाँचनी चाहिए? हाँ, पर तीन महीने की reports को trend की तरह देखिए, mood check की तरह नहीं। Weekly run, monthly review।
Author: Alice Monroe, Auspia में AI SEO Tools Analyst, जो 150+ टूल्स कवर करती हैं। Alice AI SEO tooling, benchmarks और इस बारे में लिखती हैं कि growth teams सही AI visibility stack कैसे चुनती और इस्तेमाल करती हैं।
<!--