

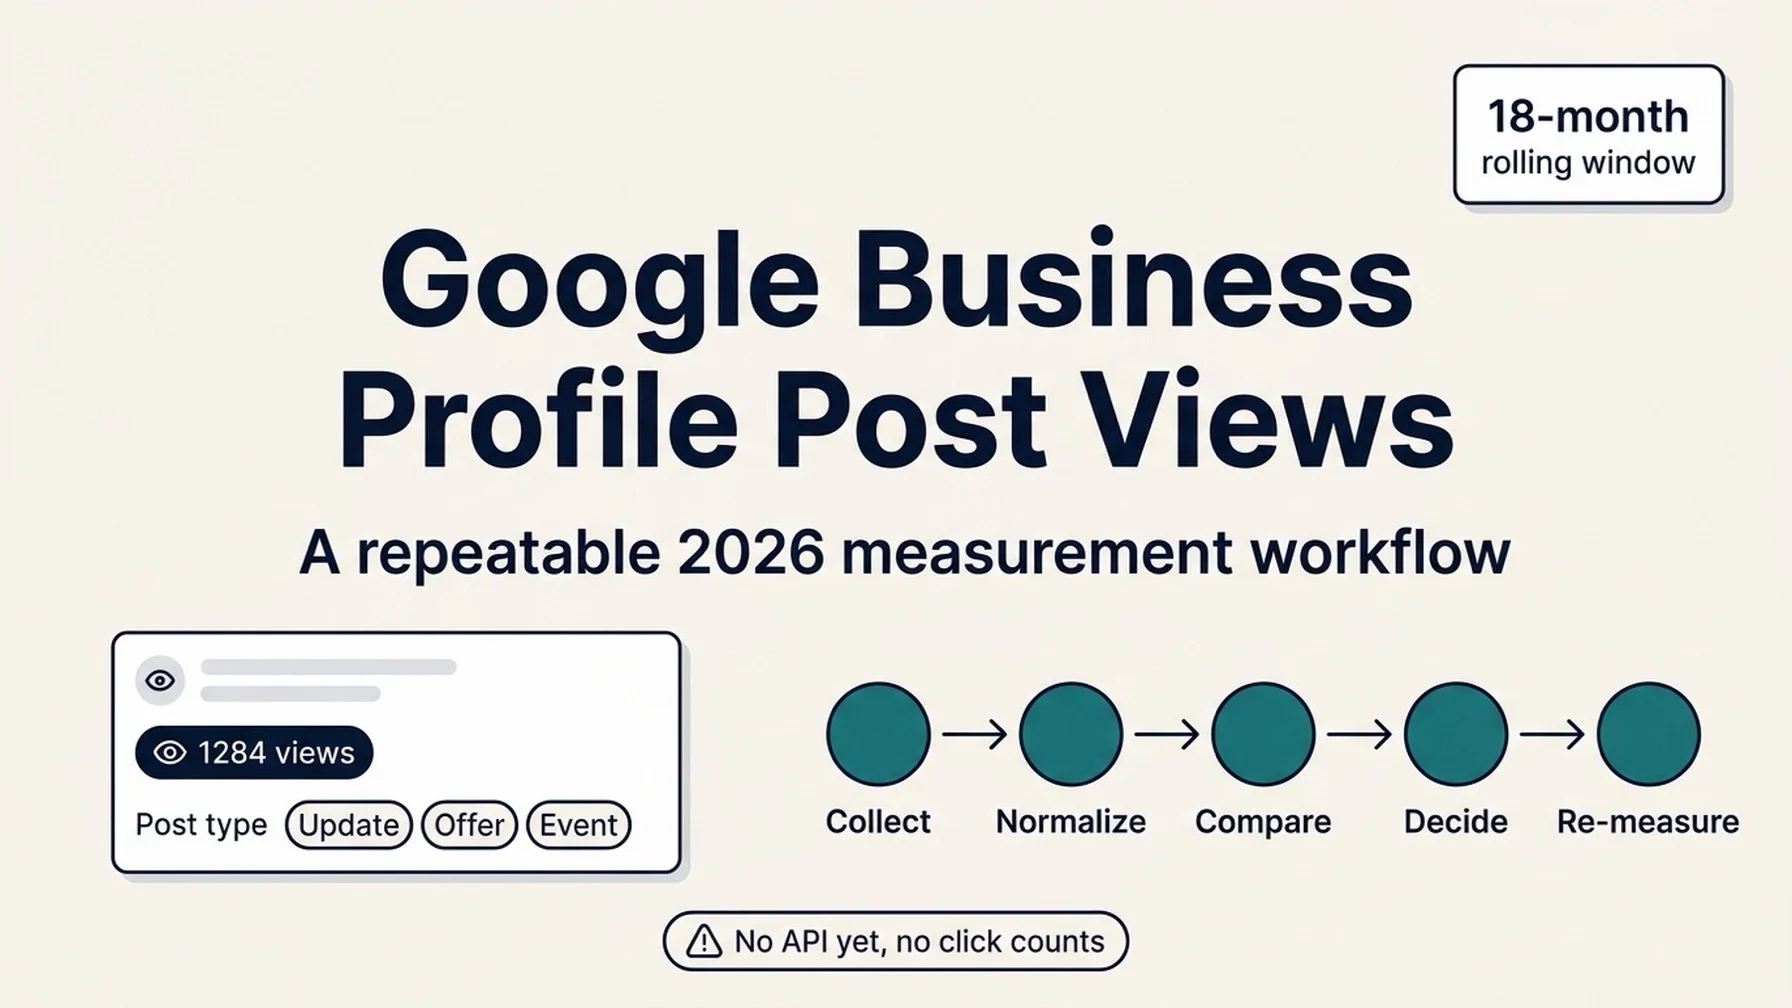
Google started showing view counts on individual Business Profile posts in September 2026, and the number finally closes a reporting gap that has been open since early 2023. This guide is about what to do with it.
If you manage one or a hundred locations, the view count alone will not tell you whether a post worked. It counts how many times people saw the post, not what they did next. The value shows up only when you compare posts against each other under fair conditions and change what you publish based on the result.
What you will finish with: a post-level measurement sheet for one or more Business Profiles, a baseline that makes posts comparable, and a written decision about which post type and cadence to keep.
Who this is for: local SEO practitioners, multi-location marketers, and owners who publish to a Business Profile at least monthly.
Prerequisites: owner or manager access to a verified Business Profile, a spreadsheet, and at least 10 published posts inside the trailing 18 months. If your profile has fewer posts than that, jump to the section on building history and run the workflow next quarter.
Time required: about 45 minutes for a single location, roughly 90 minutes for a five-location set.
Definition of done: every post in the window has a recorded view count and publish date; you have removed the posts that cannot be compared fairly; and you have one decided change to your posting plan.
What Google actually shipped, and what it did not
The feature is called Google Posts Reporting. Google announced it in the September 2026 edition of the Google Small Business Bulletin, posted to the Business Profile Help Community by Google employee Lisa Landsman. Google describes post view counts there as "one of our most requested features yet."
Here is the part that matters operationally:
Capability | Status as of September 2026 |
|---|---|
Per-post view counts | Live, on each post card in the Posts section of the dashboard |
Lookback window | Rolling 18 months of published posts |
Post types covered | Updates, offers, and events |
Surfaces combined | Google Search and Google Maps, aggregated into one number |
Click counts | Not shown |
Business Profile API | "Currently rolling out globally, not yet available in the API" |
Two of those rows deserve more than a table cell.
Impressions, not clicks. Google retired post views and post button clicks together in early 2023, and only views came back. So a post can accumulate a large view count with zero recorded action, and you cannot tell from this report whether anyone tapped the call button, the website link, or the offer. Treat the number as reach, never as response.
No API. As of publication, the Business Profile Performance API exposes no post-level metric. The available daily metrics are account-level and location-level: business impressions by device and surface, website clicks, call clicks, direction requests, bookings, food orders, and menu clicks. There is nothing per post. If your reporting lives in Looker Studio or a BI stack, this data is currently manual.
Google has not published a definition of what counts as a post view. The company does define profile views in the performance documentation (unique visitors, counted once per day, capped across devices and platforms), but the posts help page and the performance metrics page did not document post-level view counts at announcement. Whether the post number counts unique people or every appearance is unconfirmed. See it as a relative signal, not an absolute one.
That reporting gap is not new. The deprecation schedule on the Business Profile developer docs lists LOCAL_POST_VIEWS_SEARCH and LOCAL_POST_ACTIONS_CALL_TO_ACTION as ending on February 20, 2023, with no replacement resource. Photo view counts ended the same day. Post performance has effectively been a blind spot ever since.
Before you start: three things that will distort your numbers
Skip this section and your comparison sheet will produce confident wrong answers. All three problems are structural, not user error.
Posts archive at six months. Google's posts documentation states that posts older than 6 months are archived unless a date range is set. An archived post is not deleted, but it stops appearing on the profile, and it is no longer accumulating the visibility the report is measuring. The reporting window is 18 months; the natural posting life is closer to 6. A post from 14 months ago may still be sitting in your dashboard with a view count that was frozen when it archived. That number is a historical artifact, not a comparison data point.
View counts accumulate, so age is confounded with performance. An update published 15 months ago has had 15 months to collect views. One published three weeks ago has had three weeks. Ranking the two by raw views ranks them by age. This is the single most common error this report invites, and it is the reason the next section exists.
Search and Maps are already merged. You get one blended number with no way to split it. If your business skews to desktop Search and your competitor's skews to mobile Maps, the totals are not measuring the same behavior. Do not attempt to attribute a view to a surface; Google does not give you the split.
Quality check: open the Posts section and confirm you can see a view count on at least one post card. If you cannot, the rollout has not reached your profile or your region yet. Note the date and recheck in two weeks rather than assuming the feature failed.
Step 1: Build the export that Google does not give you
There is no per-post CSV. You are building the sheet by hand once, then maintaining it.
Open the Business Profile dashboard, select Posts from the dashboard menu, and work down every post card with a visible view count. Record one row per post.
Column | What goes in it | Why |
|---|---|---|
Post ID or short label | A short unique name you will recognize in three months | Joins the sheet to the live post |
Post type | Update / Offer / Event | The primary comparison axis |
Publish date | Exact date, not month | Required for any fair comparison |
View count | The number on the card | The metric |
Content hook | One clause describing the angle, e.g. "20% off brake service" | Compares message, not just format |
Photo or video present | Y / N | Isolates the effect of media |
Live or archived | Whether it still appears on the profile | Flags frozen data points |
Notes | Anything anomalous, such as a holiday, an outage, or an overlapping promotion | Explains outliers later |
For multi-location accounts, repeat per profile in the same sheet with a location column. Business Profile Manager lets you download profile performance data for many locations at once through Actions → Insights, which is useful for the account-level metrics but will not include post views. Keep the two sources separate so you do not later mistake profile views for post views.
One row per visible post, with publish dates. To check it, count your rows against the number of post cards on screen. If the view count only appears on some cards, record what you can and mark the sheet incomplete. A partial sheet with honest gaps beats a complete sheet with invented numbers.
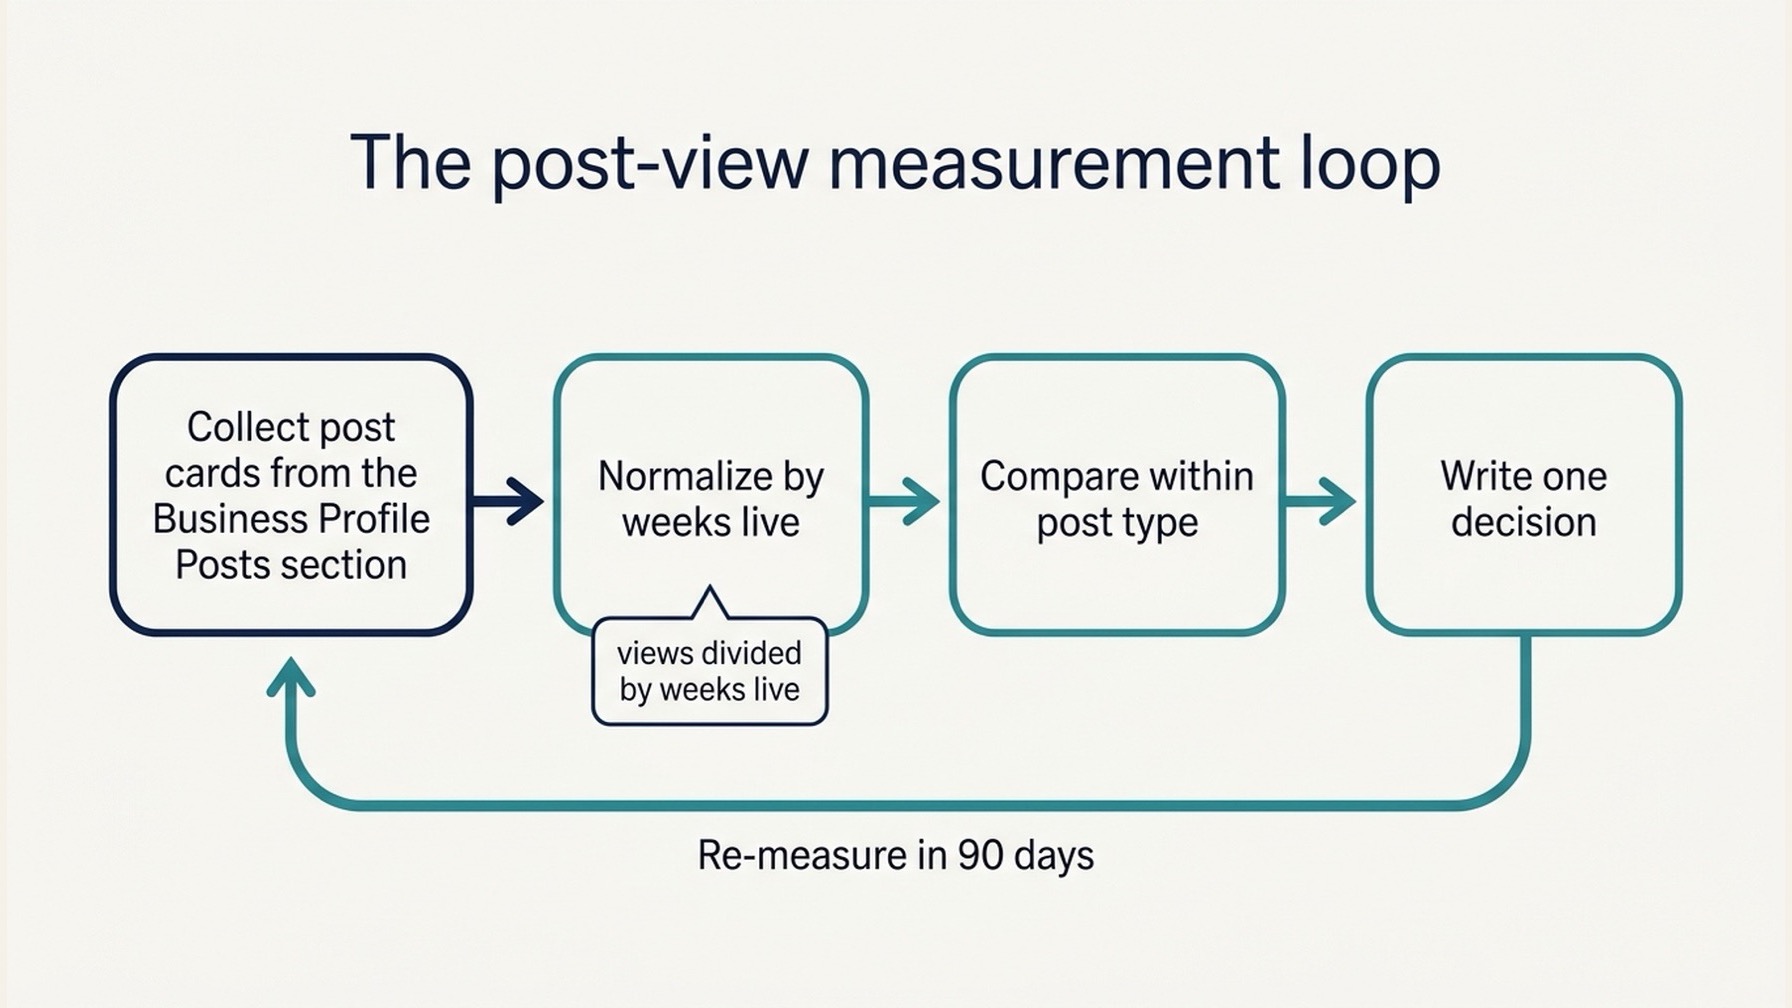
The measurement loop. The normalize stage is the one teams skip, and it is the one that makes the rest of the comparison honest.
Step 2: Normalize before you compare
This is the step almost everyone skips. Raw view counts across mixed post ages are not comparable, so convert them.
The simplest defensible approach is views per week of visible life. Take the view count and divide by the number of weeks the post has been live and visible (capped at the archive date if it archived).
views per week = total views ÷ weeks live
That single calculation removes most of the age bias and makes a 15-month-old post and a 3-week-old post directly comparable. It is approximate. Impressions are not linear, and a post's early days carry more traffic than its later ones. It is still far better than comparing raw totals.
If you want more precision and you have at least a year of history, use a fixed-window comparison instead: only compare posts that have been live the same number of weeks. Group posts into 4-week, 12-week, and 26-week cohorts and compare only within a cohort. Slower to build, much harder to argue with.
Whichever you choose, apply one method across the whole sheet. Mixing methods reintroduces the bias you just removed.
Then stratify. Compare updates against updates, offers against offers, and events against events. A seasonal offer that runs for two weeks is not competing with an evergreen update, and treating them as one pool will make offers look weak when they are simply shorter-lived.
Comparison | Fair? | Why |
|---|---|---|
Update vs. update, same cohort | Yes | Same format, same measurement life |
Offer vs. event, raw counts | No | Different lifespans and seasonal timing |
Any post vs. any post, raw counts | No | Age dominates the result |
Photo post vs. text post, same cohort | Yes | This is the question you want answered |
Search views vs. Maps views | Not possible | Google reports one combined number |
That leaves a normalized column plus a cohort or post-type grouping. Spot-check three rows by hand. If a post's publish date is unclear, as it may be for a recurring post, exclude it rather than guess.
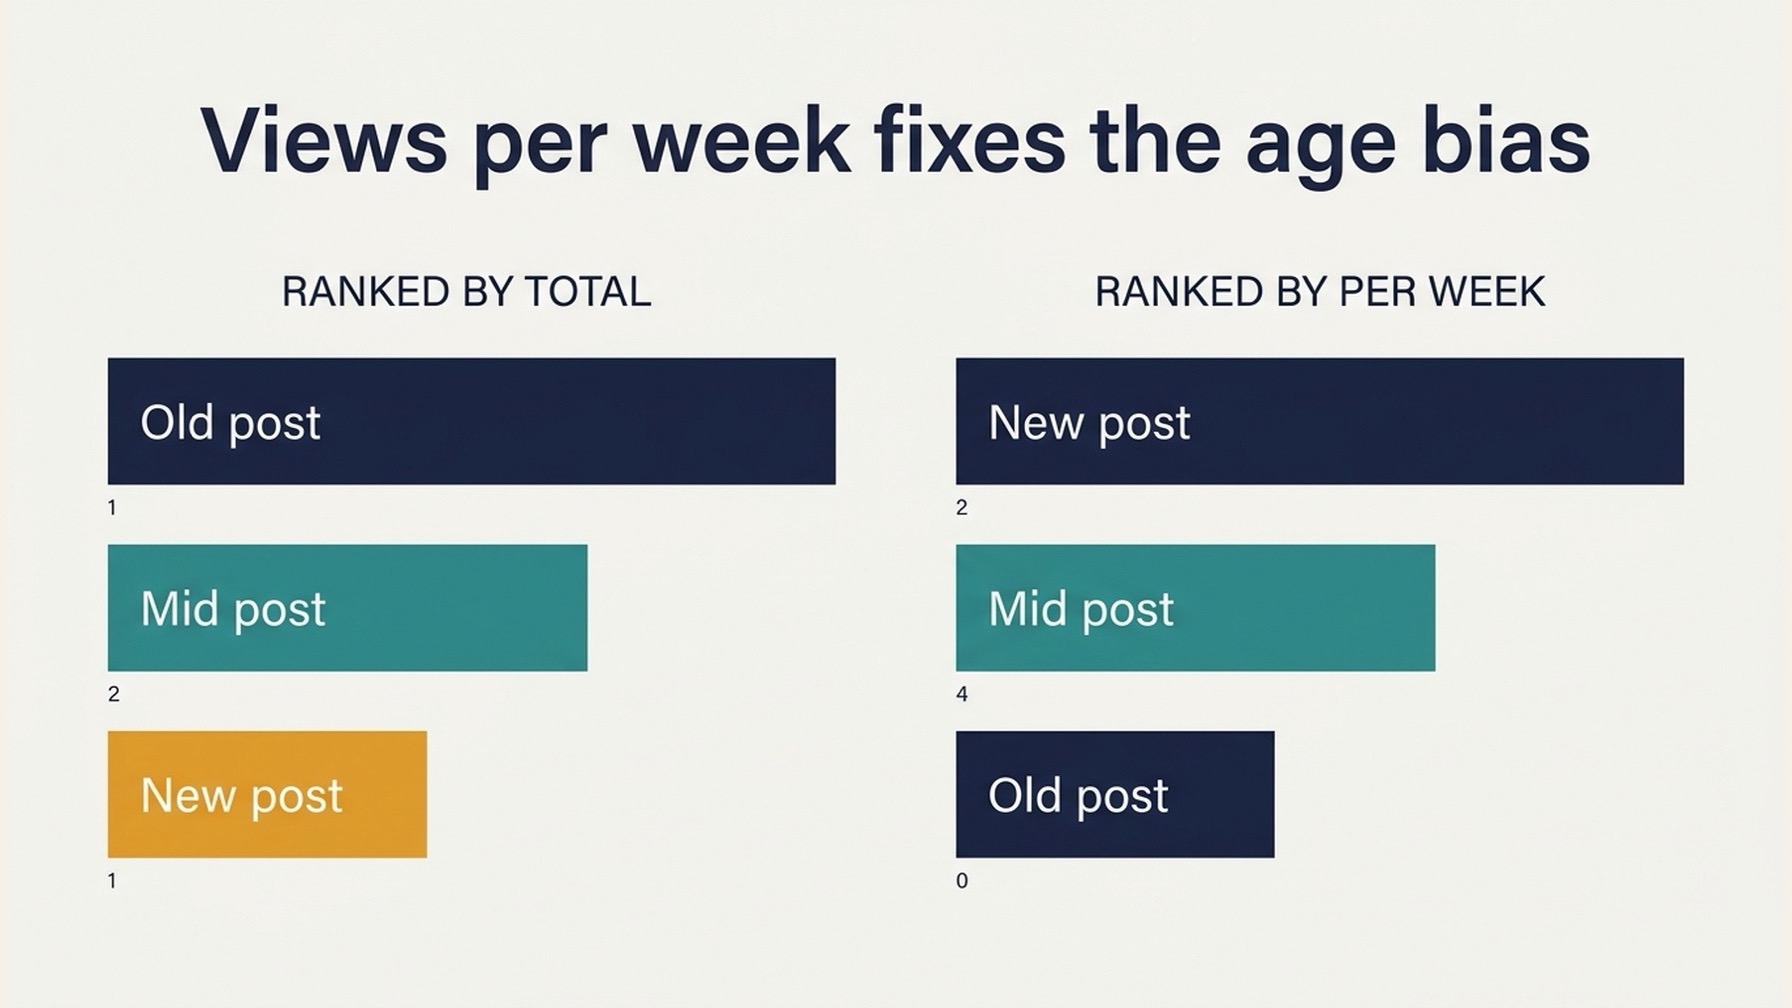
The same three posts, ranked two ways. Raw totals put the oldest post first because it has had the longest to accumulate views. Views per week puts the newest first, which is usually the more useful ranking.
Step 3: Ask the four questions the data can actually answer
With a normalized sheet you can answer four questions honestly. Resist the others.
Which post type reaches furthest for your audience? Rank the median normalized views by post type, not the maximum. One viral offer will drag a mean anywhere. If events consistently reach further than updates across your cohorts, that is a real signal and it should change what you schedule.
Does media change reach? Split the sheet by photo/video present and compare medians within a post type. This is the cleanest test available because the view count is not contaminated by click behavior.
Which content angles travel? Read the top and bottom quartiles by normalized views and look at the hook column. You are looking for a pattern in subject matter, not a single winner. "Free inspection" beating "New staff announcement" across many cohorts tells you what your local audience responds to.
Is your reach concentrated or thin? If almost all views sit on two or three posts and the rest are near zero, you have a distribution problem that more posting will not fix. If views are reasonably even across cohorts, your baseline audience is stable and cadence changes are worth testing.
Here is what the data cannot tell you, and this list matters as much as the one above:
- Whether anyone called, booked, or bought after seeing a post
- What a view is worth in revenue
- Whether a higher view count improved your local ranking
- Which surface produced the view
- Whether the same person saw the post five times or five people saw it once
If a stakeholder asks you to prove post ROI from this report, the honest answer is that this report cannot do it. You would need call tracking, UTM-tagged links, and booking data to close that loop. The post view count is an upstream diagnostic that tells you whether your message is being seen at all.
Step 4: Close the six-month gap in your own process
The reporting window is 18 months and the archive rule is 6. That mismatch has a practical consequence: if you want a long post history to measure, you have to keep posts visible deliberately.
The fix is a date range. Per Google's documentation, posts older than 6 months are archived unless a date range is set. When a post has genuine evergreen value (a standing offer, an ongoing service, an event that stays relevant), set a date range on it rather than letting it lapse. You are not gaming anything; you are telling the profile that the content is still true.
For everything else, let it archive and accept the shorter measurement life. The archive is what makes the 18-month window honest for the posts that remain.
Practical scheduling implication: if you publish weekly, you produce roughly 26 posts in six months and roughly 78 in eighteen. The 18-month window is only populated to that depth if posts survive. A 6-month archive cadence means your effective comparison pool is smaller than the window suggests, and cohort-based comparison needs enough posts per cohort to be meaningful. Once a week is the minimum cadence that keeps a cohort-based method statistically usable for a single location.
Step 5: Write one decision, then re-measure in 90 days
The output of this workflow is not a dashboard. It is a decision.
Write it down in one sentence with a number and a date. For example: "Events reach further than updates in our account, so we are moving from weekly updates to one offer and one event per month, and we will re-run this sheet on December 15."
Then set the re-measurement date. Ninety days is long enough to accumulate new posts in each cohort and short enough that you still remember what you changed. Three things should be true at the next review:
- Every new post has an entry in the sheet.
- You have at least four posts in each cohort you are comparing.
- The comparison method and cohort boundaries are unchanged.
If any of those is false, fix the process before interpreting the numbers.
The verification checklist
Run this before you act on any conclusion.
- [ ] Every post in the sheet has an exact publish date
- [ ] Archived posts are flagged, and their view counts treated as frozen
- [ ] One normalization method applied to every row, not mixed
- [ ] Comparisons happen within post type and within cohort
- [ ] You used medians, not means, for post-type comparisons
- [ ] No conclusion is drawn about clicks, calls, bookings, or revenue
- [ ] The surface split is not claimed anywhere, because Google does not provide it
- [ ] One written decision exists, with a number and a re-measurement date
Where this fits with the rest of your local reporting
Post view counts are one layer of a measurement stack you should keep distinct:
Layer | Source | What it proves |
|---|---|---|
Post reach | Business Profile Posts section | A message was seen |
Profile discovery | Business Profile Performance | People found the profile; calls, clicks, directions |
Site behavior | Analytics with UTM tagging on post links | A post drove a session |
Outcomes | Booking or POS systems | A post produced a transaction |
Only the first two come from Google's local surfaces, and only the second is available through an API today. Keep them in separate tables so nobody later mistakes profile views for post views. This rollout makes that mistake newly easy, since both numbers now appear in adjacent screens.
If you want to check whether those downstream surfaces are actually crawlable and readable by search and AI systems before you invest in more local content, the Auspia tools directory has crawl and index simulators you can run against any public URL. That is a different question from post reach, but it is the next one worth asking.
FAQ
Does Google Business Profile show clicks on posts? No. Google retired post button clicks alongside post views in February 2023, and only views returned. The current report shows a view count with no click equivalent.
How far back do the view counts go? Google states the reporting covers posts published over the past 18 months on a rolling basis. Note that posts archive at 6 months unless a date range is set, so older posts may carry a frozen count.
Why can I not see view counts on my posts? The feature was described as rolling out globally at announcement, so availability may lag by profile or region. Check the Posts section of the dashboard on desktop first. If counts do not appear, note the date and recheck in two weeks.
Can I pull post views through the Business Profile API? Not as of September 2026. Google's bulletin states the feature is "not yet available in the API." The Performance API's daily metrics are account and location level and include no post-level metric.
Is a high post view count good for local ranking? There is no published evidence that post views affect local ranking. The view count measures whether your message was seen. Local ranking depends on relevance, distance, and prominence, with your primary category and review signals carrying more weight.
How often should I post to get useful data? Google's own community guidance warns against over-posting because it pushes current offers down. For measurement purposes, weekly is the practical minimum: it produces enough posts per cohort for a within-type comparison to mean something within a quarter.
What is the single biggest mistake with this report? Comparing raw view counts across posts of different ages. Older posts accumulate more views mechanically, so raw totals mostly rank posts by age. Normalize by weeks live, or compare only within cohorts of equal age.
Author: Miles Donovan, Local AI Search Analyst Across 500+ Service Queries at Auspia. Miles writes about local visibility, service-area pages, and how local businesses show up in search and AI recommendations.