Google Trends Adds Interactive Explore Maps and Regional Breakdown
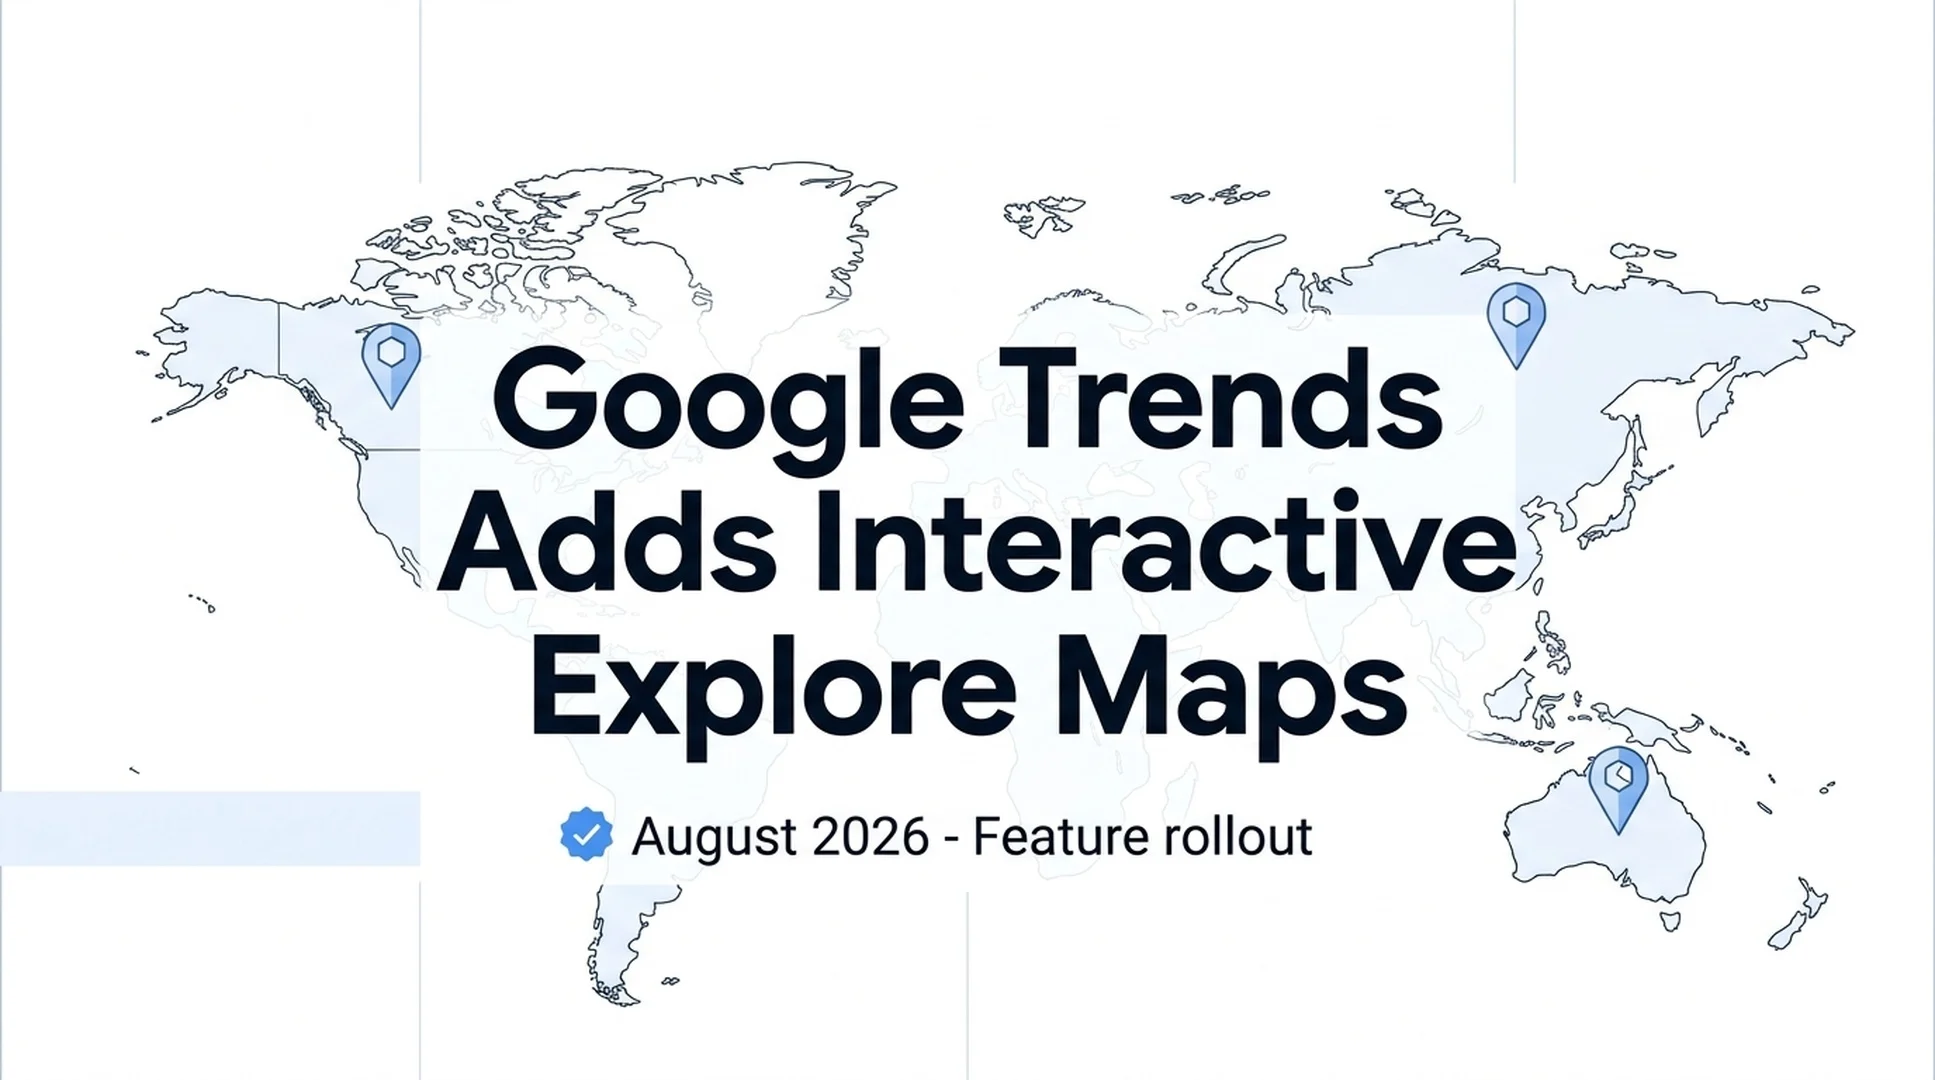
Google Trends launched new interactive map visualizations and a regional breakdown feature on August 19, 2026, giving SEO professionals and researchers a clearer way to see where search interest is concentrated geographically.
What was announced
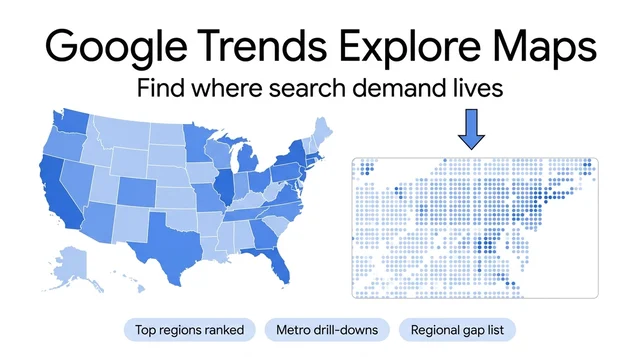
Google Search Central announced the addition of Explore maps and regional breakdown to Google Trends. The update introduces interactive map-based visualizations that let users see the geographic distribution of search interest for any query, replacing the previous text-based regional data with a visual, map-first interface.
The feature is available at trends.google.com/explore and is being rolled out gradually, so not all users may see it immediately.
What changed
Before this update, Google Trends showed regional interest as a ranked list of geographic areas — countries, states, or metro areas — with relative interest scores. Users had to mentally map those numbers to locations or cross-reference with external tools.
The new Explore maps feature displays that same data directly on an interactive map. Users can:
- Instantly spot which regions show the highest search interest for a query
- Compare geographic patterns across multiple terms
- Visualize regional trends for content planning and localization strategy
- Export or capture map visualizations for reporting
The regional breakdown component provides more granular geographic data, allowing deeper analysis of sub-national search patterns.
Details and availability
Google said it "designed new interactive maps for clearer data storytelling" and that users can now "instantly spot regional trends, capture visual insights for your audience, and explore the 'where' behind every search with our new, intuitive maps."
The feature is available to all users at trends.google.com/explore. Google noted that the experience is being rolled out gradually, so availability may vary by account and region during the initial launch period.
Context
Google Trends has been a standard tool for SEO practitioners conducting keyword research, content planning, and competitive analysis. The ability to see regional search patterns has always existed, but the presentation was limited to tabular data.
The map-based visualization aligns with a broader shift toward visual data storytelling in analytics tools. For local SEO and content localization work, the ability to quickly identify geographic search patterns — without manually parsing ranked lists — reduces friction in the research process.
The update comes as Google continues to invest in making Trends more accessible for content strategy. In recent months, Google has added Gemini integration and advanced capabilities to the Explore page for signed-in users.
What has not been confirmed
Google has not published detailed documentation on the new map features in the Trends Help Center as of this report. Specifics about data granularity (whether maps extend to city-level or remain at state/metro level), export formats for the map visualizations, and API access to the map data have not been publicly detailed.
The rollout timeline for full global availability has not been specified beyond "gradually."
Sources
- Google Search Central LinkedIn post, August 19, 2026
- Google Trends Explore page: https://trends.google.com/explore