

What you will finish with
This is a 30-minute workflow for SEOs, content planners, and local business marketers who want to see where a search term is gaining interest, not just when. You will end with a short list of regions and cities worth targeting, plus a content plan that says which page or section to build for each one.
- Who it is for: SEOs, local marketers, and content teams working with location-specific terms (services, retail, niche topics).
- What you get: a geographic gap list, one working example to follow, and a monthly re-check routine.
- You need: a free Google Trends account (sign-in optional for the classic Explore view), and a term that people actually search in more than one place.
- Definition of done: you can name the top regions for your term, explain what a 100 score means, and point at two concrete pages you should build because of what the map showed.
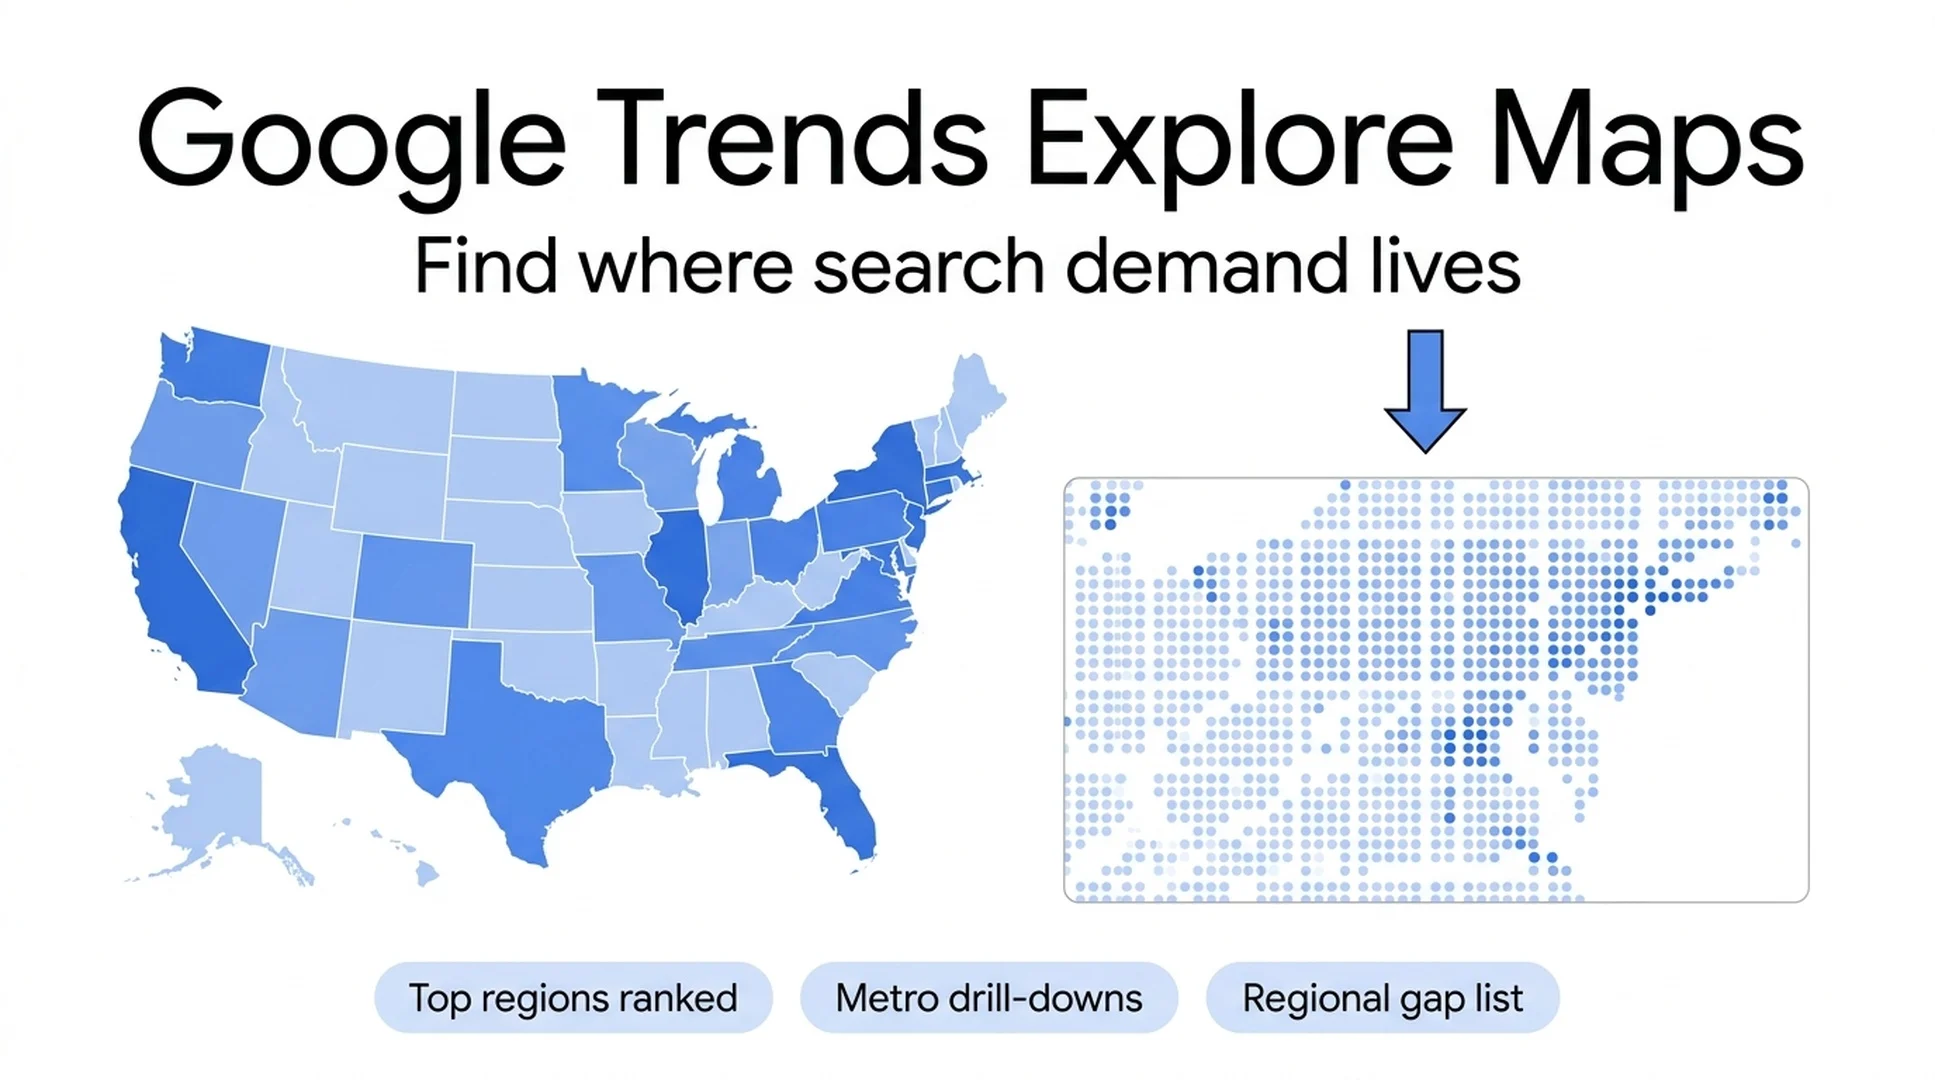
The context for why this matters: in August 2026, Google Search Central announced that Explore now comes with interactive maps and regional breakdowns, so you can "explore the where behind every search" instead of just watching the interest line. Google said the rollout is gradual, so the exact UI can differ by account. The workflow below uses the live Explore view as it stands today, and the screenshots are real captures, not mockups.
What you're working with: two Explore surfaces
Google Trends currently points you at two places, and they are easy to confuse:
- Classic Explore (trends.google.com/trends/explore) - the search box, the interest line, and the regional map with its top-regions list. Everything below works here, logged in or not.
- New Explore (trends.google.com/explore) - the Gemini-powered version Google is rolling out. Right now it asks you to sign in to unlock Gemini and the advanced capabilities, and offers a "Remain on Classic Explore" link if you do not want to.
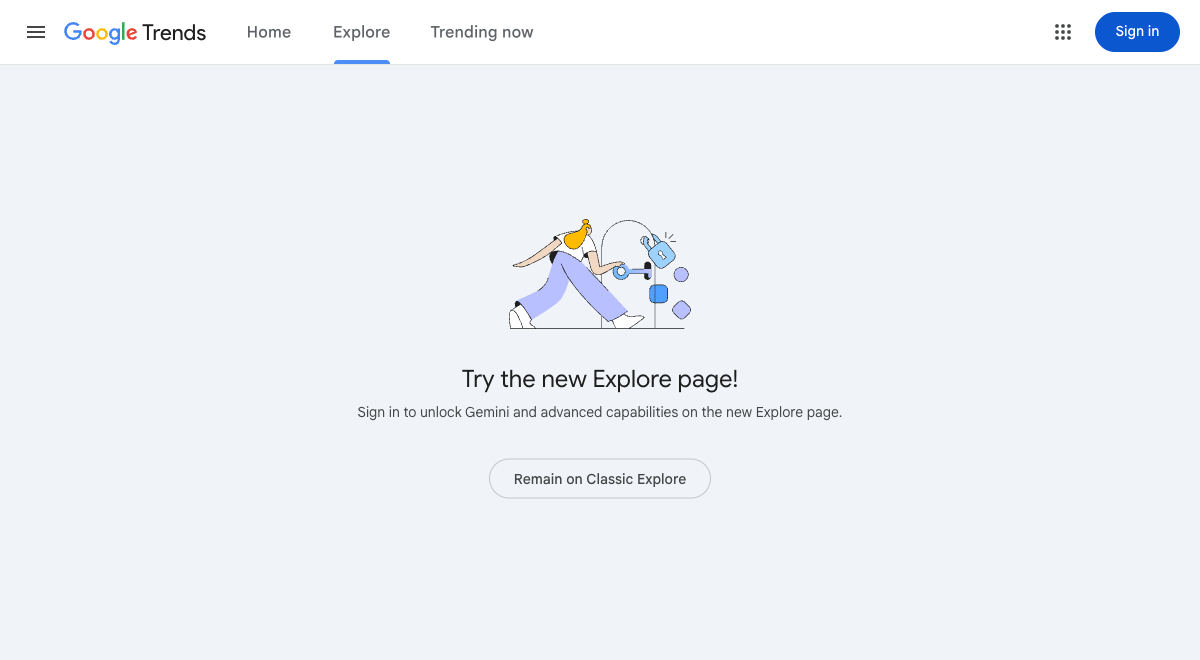
If you land on the sign-in gate, take the classic path. The map features in this walkthrough are available there, and you do not need a Google account for the core workflow.
Step 1: Run a query and switch to the map
Open Classic Explore, type a term, and set two filters: the country you care about (or Worldwide) and a time window. The past 90 days is a good default; past 12 months is better when you want to separate seasonal spikes from real regional demand.
The map panel is called "Interest by subregion" (or by metro or city, depending on the geographic level). On a country-level search it shows a choropleth map plus a ranked list of the strongest regions.
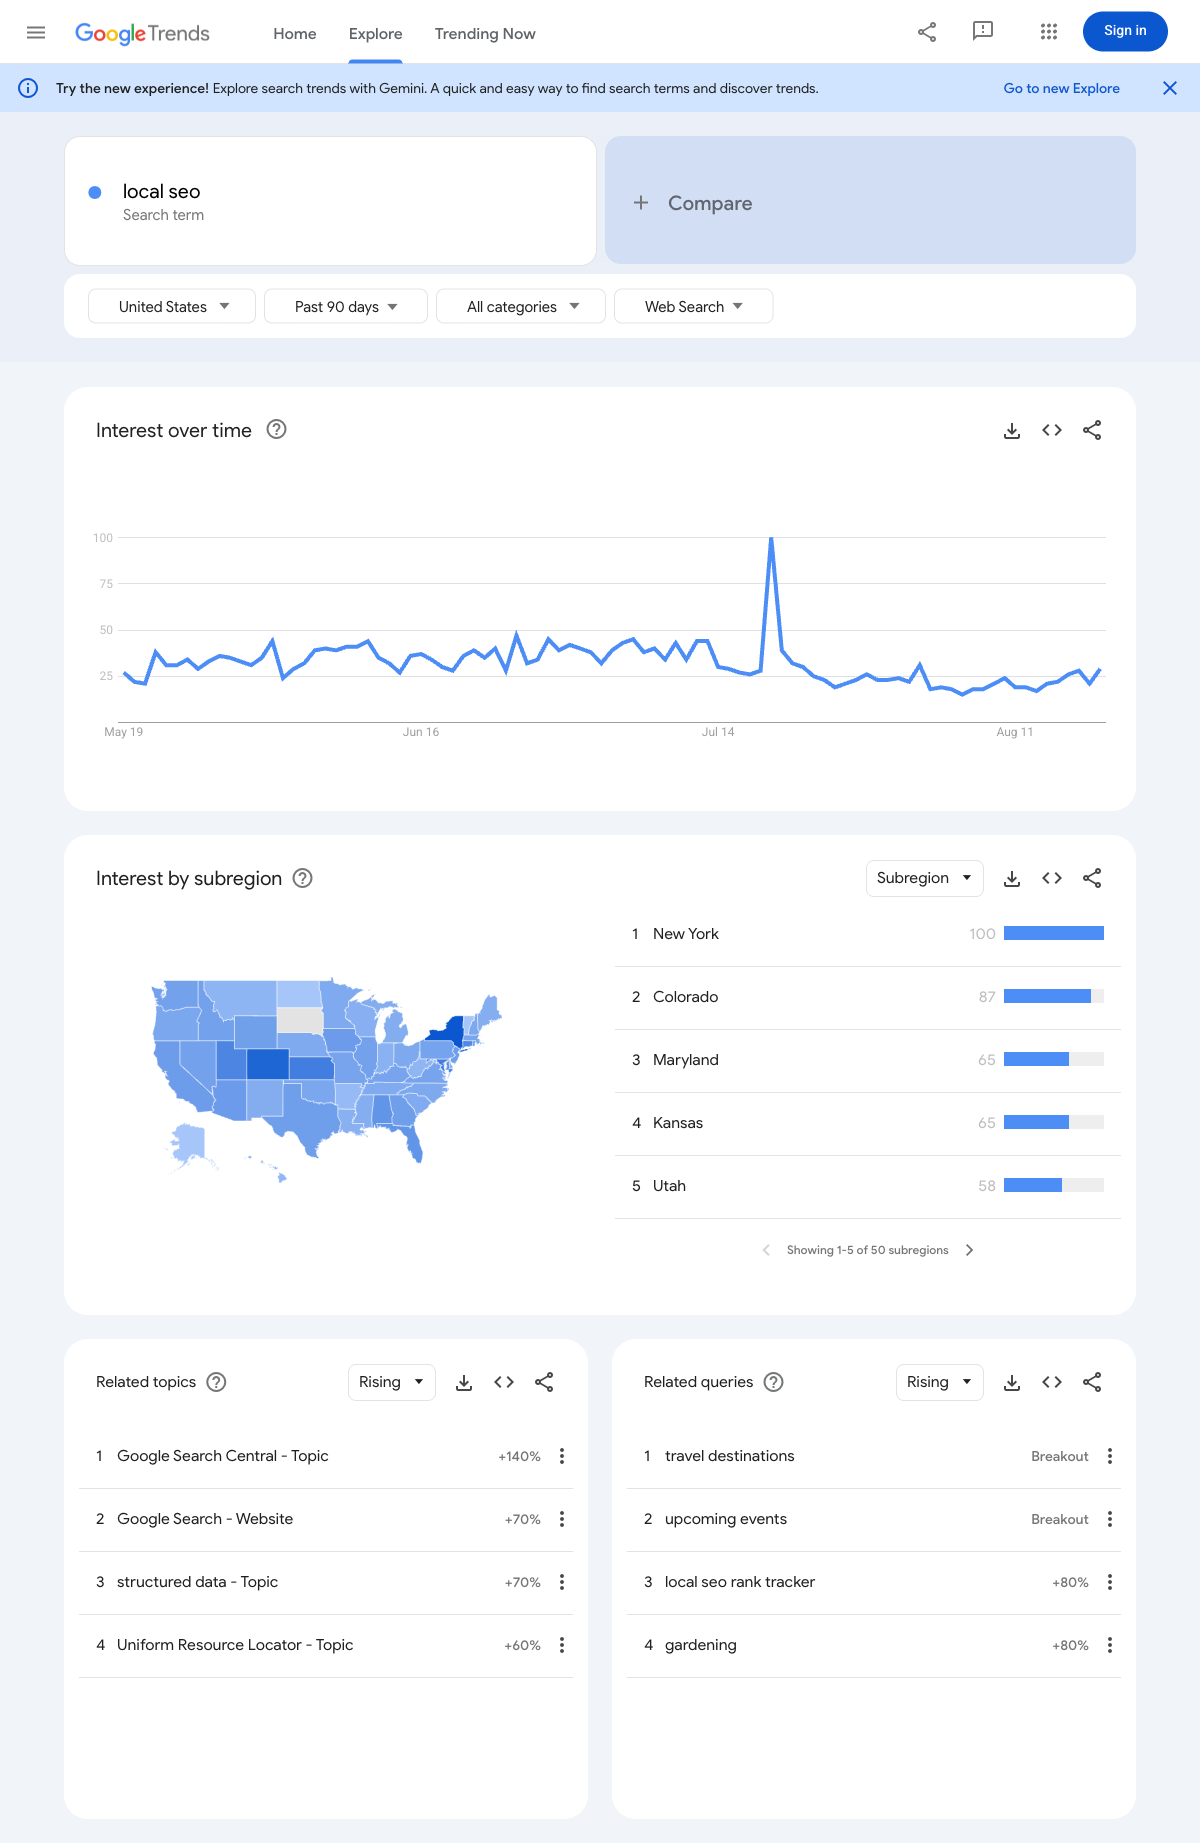
Expected output: a map with the top regions ranked, e.g. "local seo" in the US over the last 90 days puts New York (100), Colorado (87), Maryland (65), Kansas (65), and Utah (58) at the top of 50 subregions.
Quality check: the map should render in about five seconds. If the "Related topics" or "Related queries" panels show an error, that is a transient widget failure, not a data problem; reload the page.
Recovery path: if the map stays blank or the term is too niche, you get a "not enough data" warning. Switch to a broader term (services instead of the brand name, category instead of product) or widen the time range.
Step 2: Read the regional breakdown like an analyst
The ranked list is the part people misread. A score of 100 does not mean that region has the most searches for the term. The score is normalized against the region's total search volume, so 100 means the term takes the largest share of that region's searches.
Concretely: New York at 100 means "local seo" is a bigger slice of New York's search mix than of any other state's. It is a share signal, not a volume signal. Two things that are actually useful follow from that:
- Small, less populated regions at the top of the list often hide underserved demand. A state where your term is 10% of searches is more targetable than a state where it is 2%, even if the 2% state has more absolute volume.
- The gap between ranks tells you how concentrated the demand is. A drop from 100 to 87 is mild; a drop from 100 to 20 means the term is basically a one-region phenomenon.
Expected output: a written note like "demand is strongest in NY and CO, with a meaningful second tier in MD, KS, UT."
Quality check: before you act on it, run the same term in a second country or with a different time range and confirm the same regions keep appearing. If the leader board changes completely, your term is seasonal, not regional.
Step 3: Drill into a region that matters to you
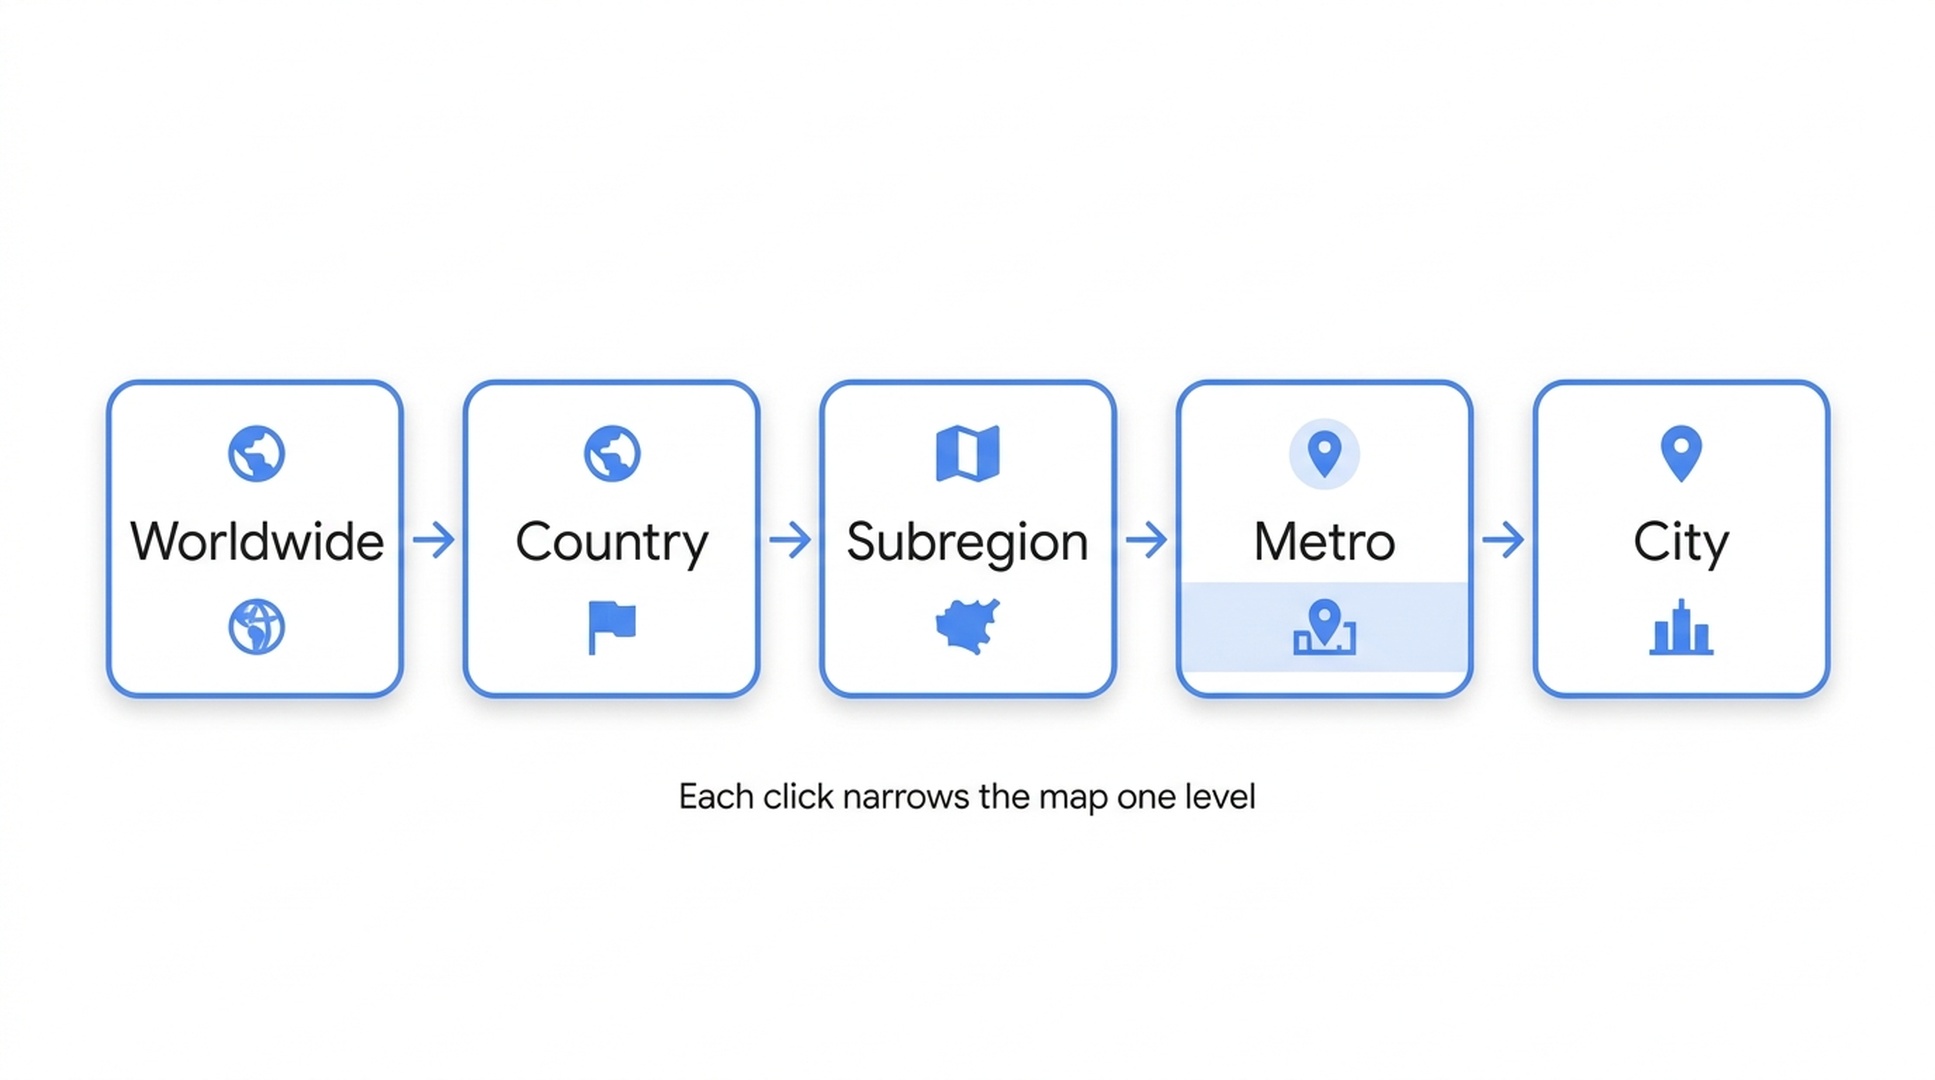
Click a region on the map (or its row in the list). Explore re-runs the query for that region only and switches the resolution down a level, from subregion to metro or city.
In the Colorado example, drilling in reveals Denver at 100 and Colorado Springs-Pueblo at 56, and the rising queries panel fills with gold: "local dentist seo" and "affordable local seo services near me" at Breakout level, "local seo for small businesses" up 4,550%, "affordable local seo services" up 2,550%, "local seo expert" up 180%. Breakout means growth over 5,000% versus the previous period, per Google's own definition.
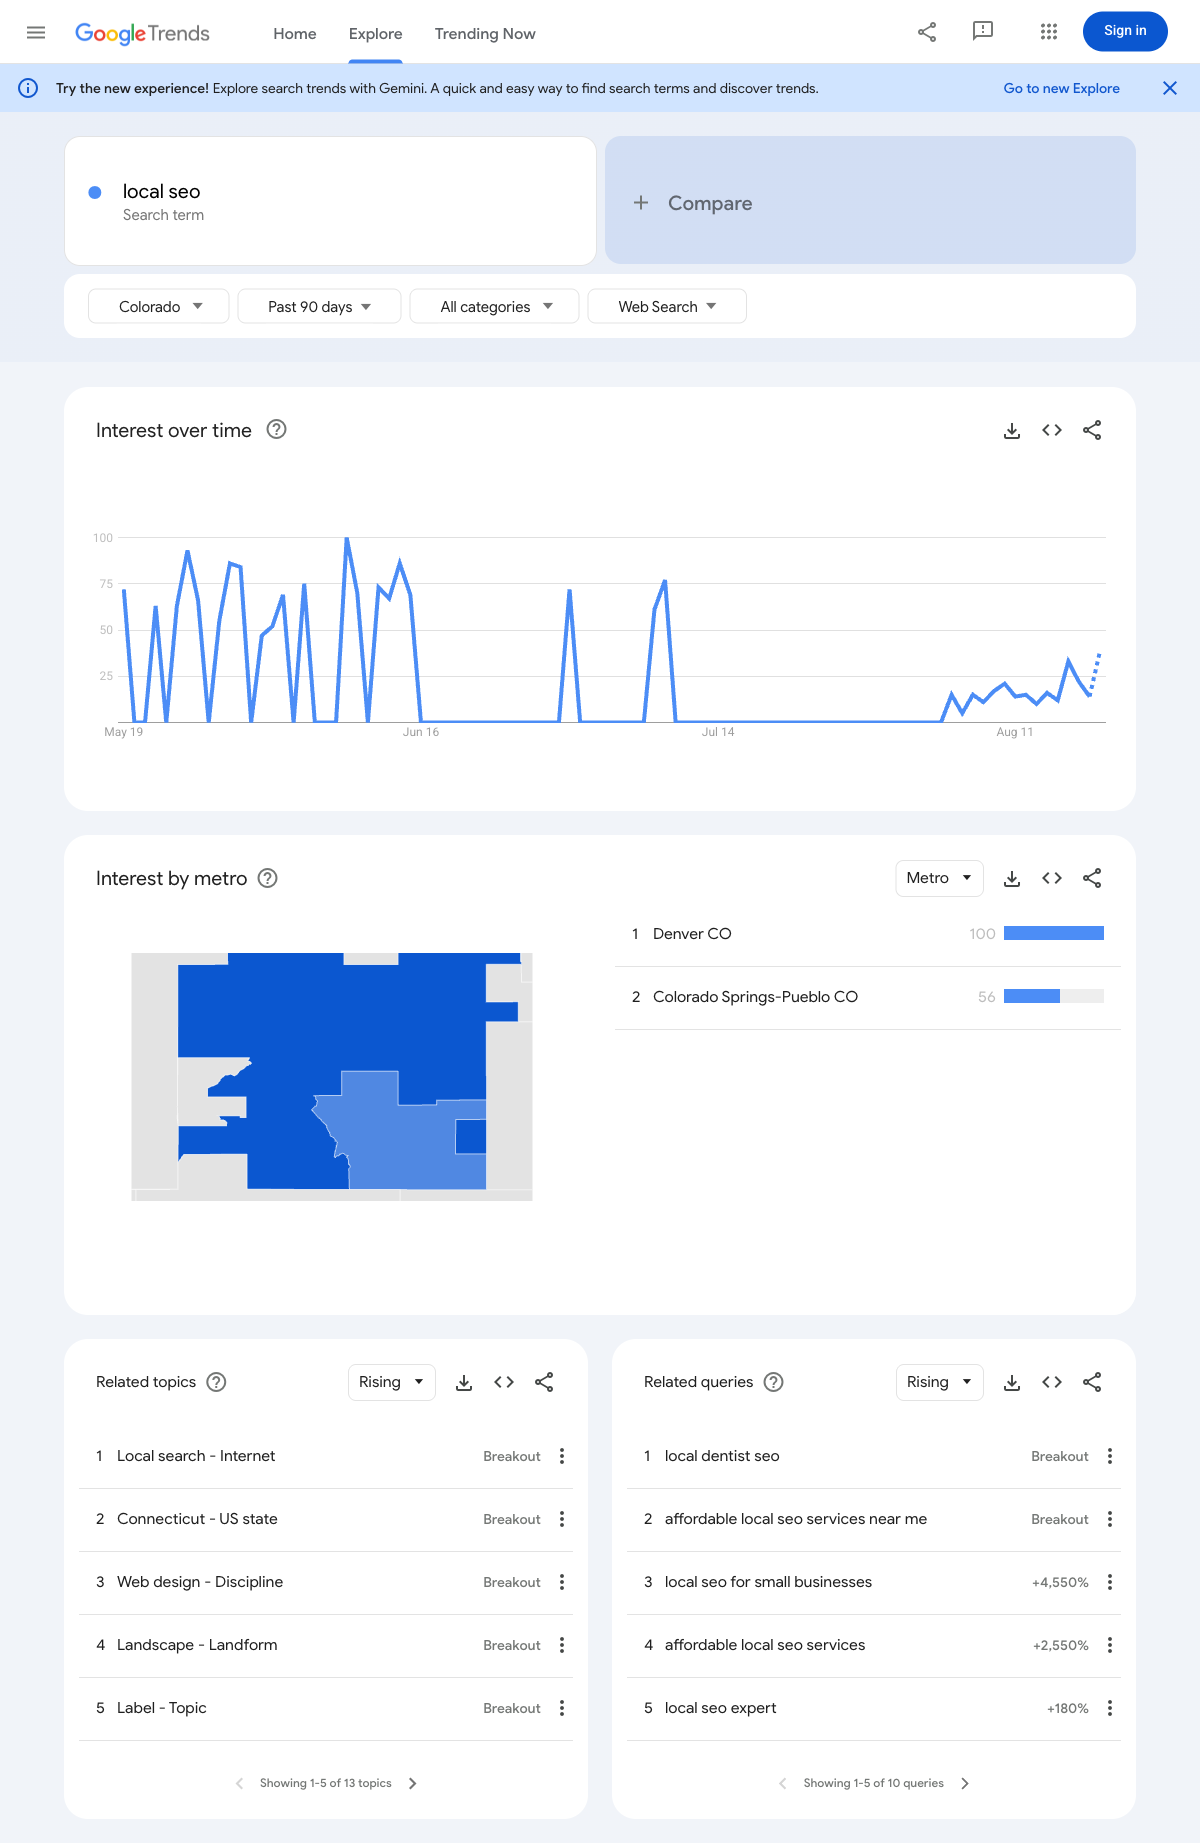
Expected output: a metro-level map plus the top rising queries for that region.
Quality check: the URL should now contain the region code (e.g. geo=US-CO). That is your signal that the drill-down actually applied.
Recovery path: if the metro list shows only one or two entries, the term is too thin at that resolution. Zoom back out and work with the subregion list instead.
Step 4: Turn the map into a geographic gap list
You now have the raw material. For each region and metro in your list, ask what a searcher in that place would be looking for that you do not currently publish:
Map signal | What it means | Action that fits |
|---|---|---|
Region scores high, you have no local page | Demand exists, zero local relevance | Build a region-specific service or landing page |
Metro appears in the top-5, subregion does not | Demand is city-level, not state-level | Add a city page or a metro-specific section |
Rising query is a phrase, not a topic (e.g. "affordable local seo services near me") | Transactional intent in that area | Match the page title and H2 to the phrase |
Breakout topic appears in one region only | Localized spike, likely an event or campaign | Check whether it is durable before committing content |
Region drops sharply over 12 months | Demand moved away | Do not build new pages; refresh what exists |
Write the output as a three-column table: region, signal, and the page you would build. Two to four rows is enough for one working session. You should end with a table where every row names a concrete page or section, and every row references a signal you actually saw on the map or in the queries panel. If a row fails that test, delete it.
Step 5: Turn the gap list into pages and content
This is where the map stops being interesting and starts being work:
- For each row, write the page with the region in the title and the first H2, in natural language ("SEO for Colorado Springs plumbing companies", not "Colorado Springs local SEO services" stuffed into every paragraph).
- Use the rising query phrases from Step 3 as the actual section headings. Google Trends is telling you what people in that region type; reuse their words.
- Add region-specific facts that only make sense locally: service areas, pricing notes, licensing, or seasonal demand. A page that could be duplicated by a script is not a page.
- Keep the map open while you write. Check the region's top 5 queries again; they are your outline.
You are done when each gap row has a finished page draft. Test it without the map: if nothing on the page would help a searcher who lives in that region, it fails. And if you have no content resources this month, the minimum viable move is a region filter or section on an existing page, not a new URL. Only build the URL when the section alone cannot answer the queries.
Verify: the 10-minute completion check
Run this before you close the tab:
- [ ] You can explain the score for your top region (share, not volume).
- [ ] The URL of your drill-down contains the region code.
- [ ] Your gap table has 2-4 rows, each backed by a map signal.
- [ ] Each row names a page or section, with the region in the title.
- [ ] At least one page uses a rising query phrase from the queries panel.
Keep the results current
Regional interest moves. A term that is New York-heavy in August can be Texas-heavy by November. Re-run the same query once a month, on the same time window, and compare the leader board. Three signals matter: the top region changed, a new region entered the top five, or a Breakout query appeared in a region you serve. Any of those is a content update trigger. Nothing else in this workflow needs daily attention; monthly is the right cadence for map-level data.
Mistakes that waste the map
- Reading 100 as raw volume. This is the big one; it sends people building pages for the wrong states.
- Judging a region on a 7-day window. Short windows are noise; use 90 days minimum for regional reads.
- Copying the rising query into the page title verbatim without checking whether it makes sense as a sentence. Breakout phrases like "local seo" spikes are useful, but some are event-driven and vanish.
- Ignoring the resolution switcher. The map defaults to subregion, but metro and city views answer different questions. Use all three.
FAQ
Do I need a Google account to see the regional maps? No. The classic Explore view with the map and the ranked list works without signing in. The new Gemini-powered Explore currently asks for a sign-in.
Does the map show search volume by region? No. It shows relative interest, normalized so 100 is the strongest share in the selected geography. For absolute volume, pair Trends with your own search volume data.
Why does my region not show on the map? Either the term has too little data at that resolution (switch to subregion or a broader term) or the region is not among the top results, which only lists a limited number of rows.
Is the new Explore the same as the map I already used? The new Explore adds Gemini-based search assistance and is being rolled out gradually. The regional map and breakdowns described here are the Explore map surfaces Google announced in August 2026; Google's own wording says the rollout is step by step, so the exact UI can vary by account.
How often should I re-check regional interest? Monthly, on the same 90-day or 12-month window, comparing the leader board. Seasonal terms need a full year of data before you trust any regional conclusion.
Author: Miles Donovan, Local AI Search Analyst Across 500+ Service Queries at Auspia. Miles writes about local visibility, service-area pages, and how search data reveals where demand actually lives.