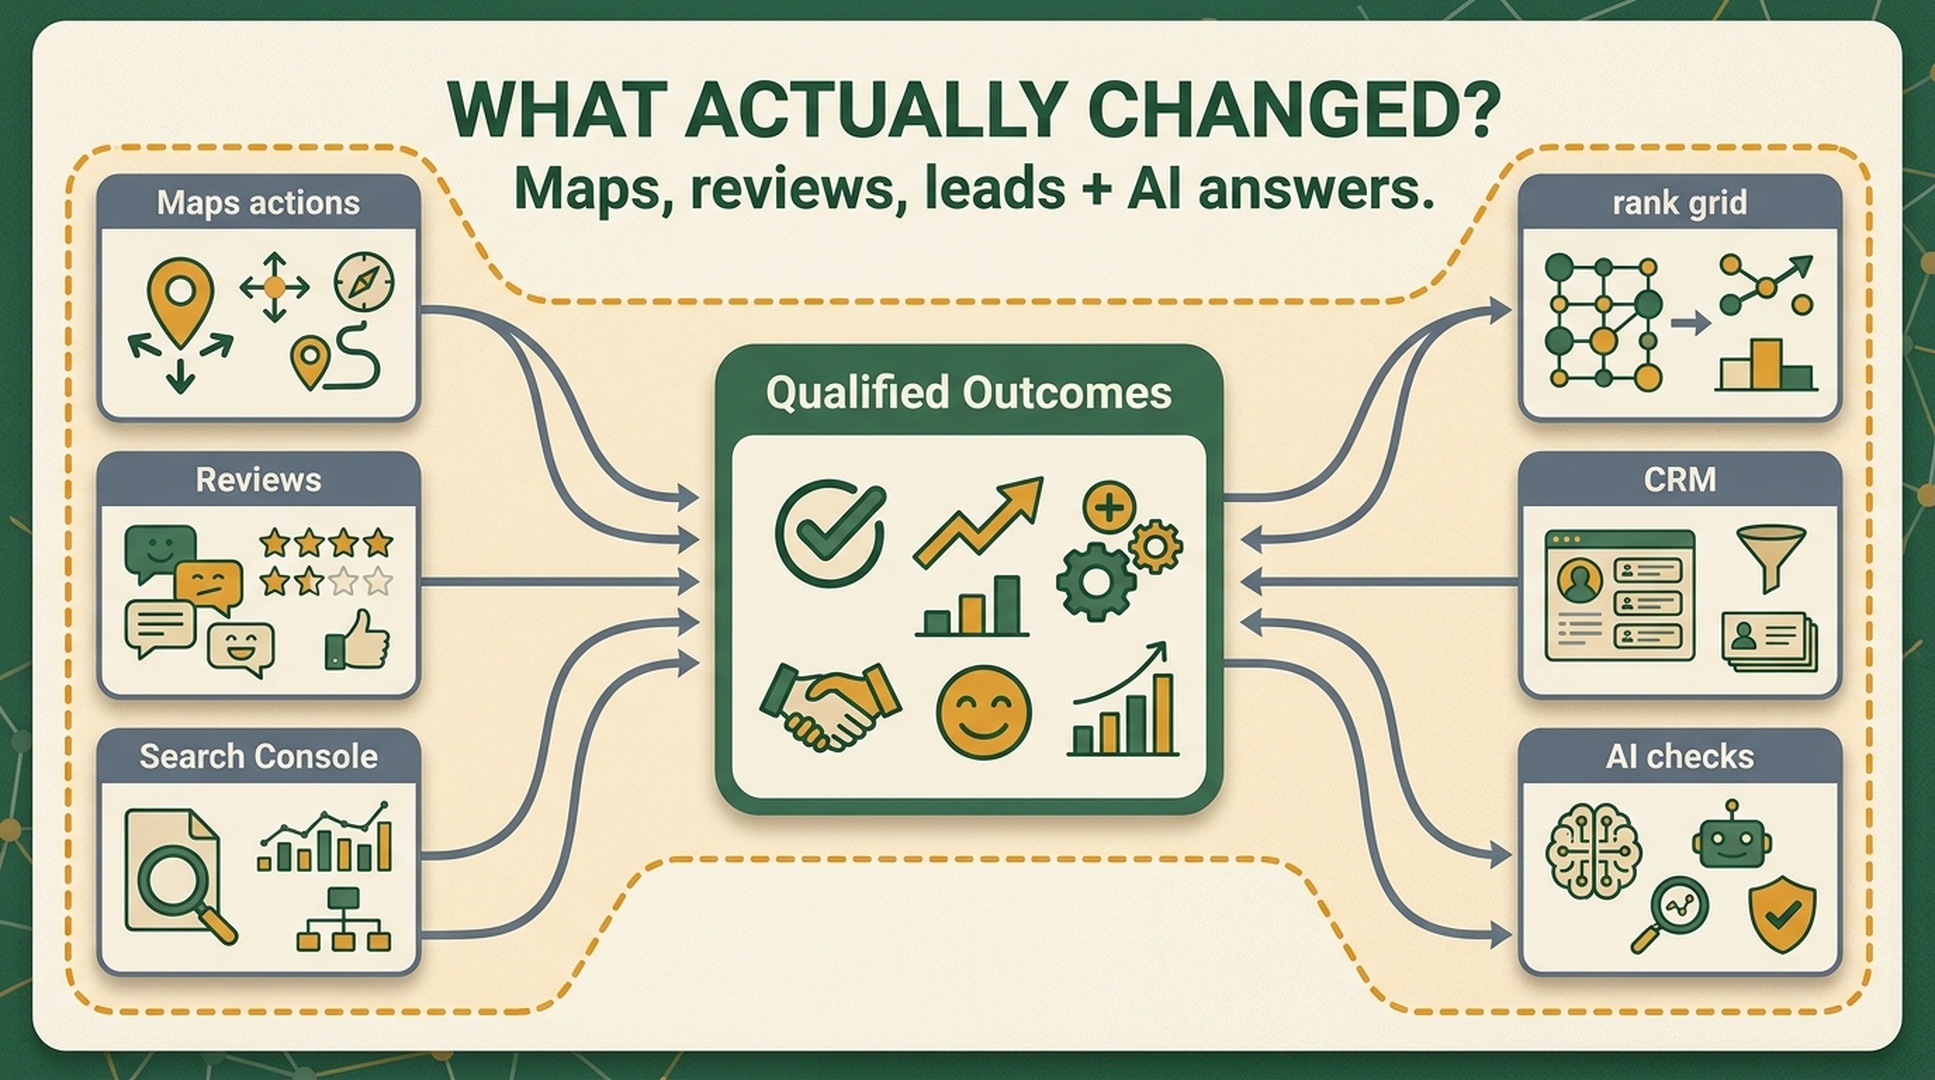
A rank grid moved. Calls did not. What should the team conclude?
Probably less than the monthly report suggests.
A business can become more visible in a local rank grid while calls stay flat because the grid sampled the wrong neighborhoods, the business moved for low-intent queries, the call route failed, or the extra exposure did not reach qualified buyers. The opposite can happen too: a rank position looks unchanged while calls rise because a review theme, booking path, hours, or demand mix improved.
The same caution applies to AI visibility. A ChatGPT, Gemini, Perplexity, AI Overview, or AI Mode mention can be useful evidence, but it is not a confirmed lead or a disclosed ranking score. It is an observed answer for a particular prompt, context, date, and product experience.
For US and Canadian local businesses, the useful dashboard connects five questions rather than chasing one number:
| Question | Decision it supports | Evidence to use |
|---|---|---|
| Can nearby customers find us? | Maps, local organic, and service-area coverage priorities | Business Profile performance, rank-grid samples, Search Console queries and pages |
| Do they trust the business? | Reputation and service-recovery work | Review volume, rating context, themes, response quality, complaint log |
| Do they take a meaningful next step? | Conversion-path and staffing changes | Calls, directions, website clicks, bookings, forms, CRM disposition, revenue where available |
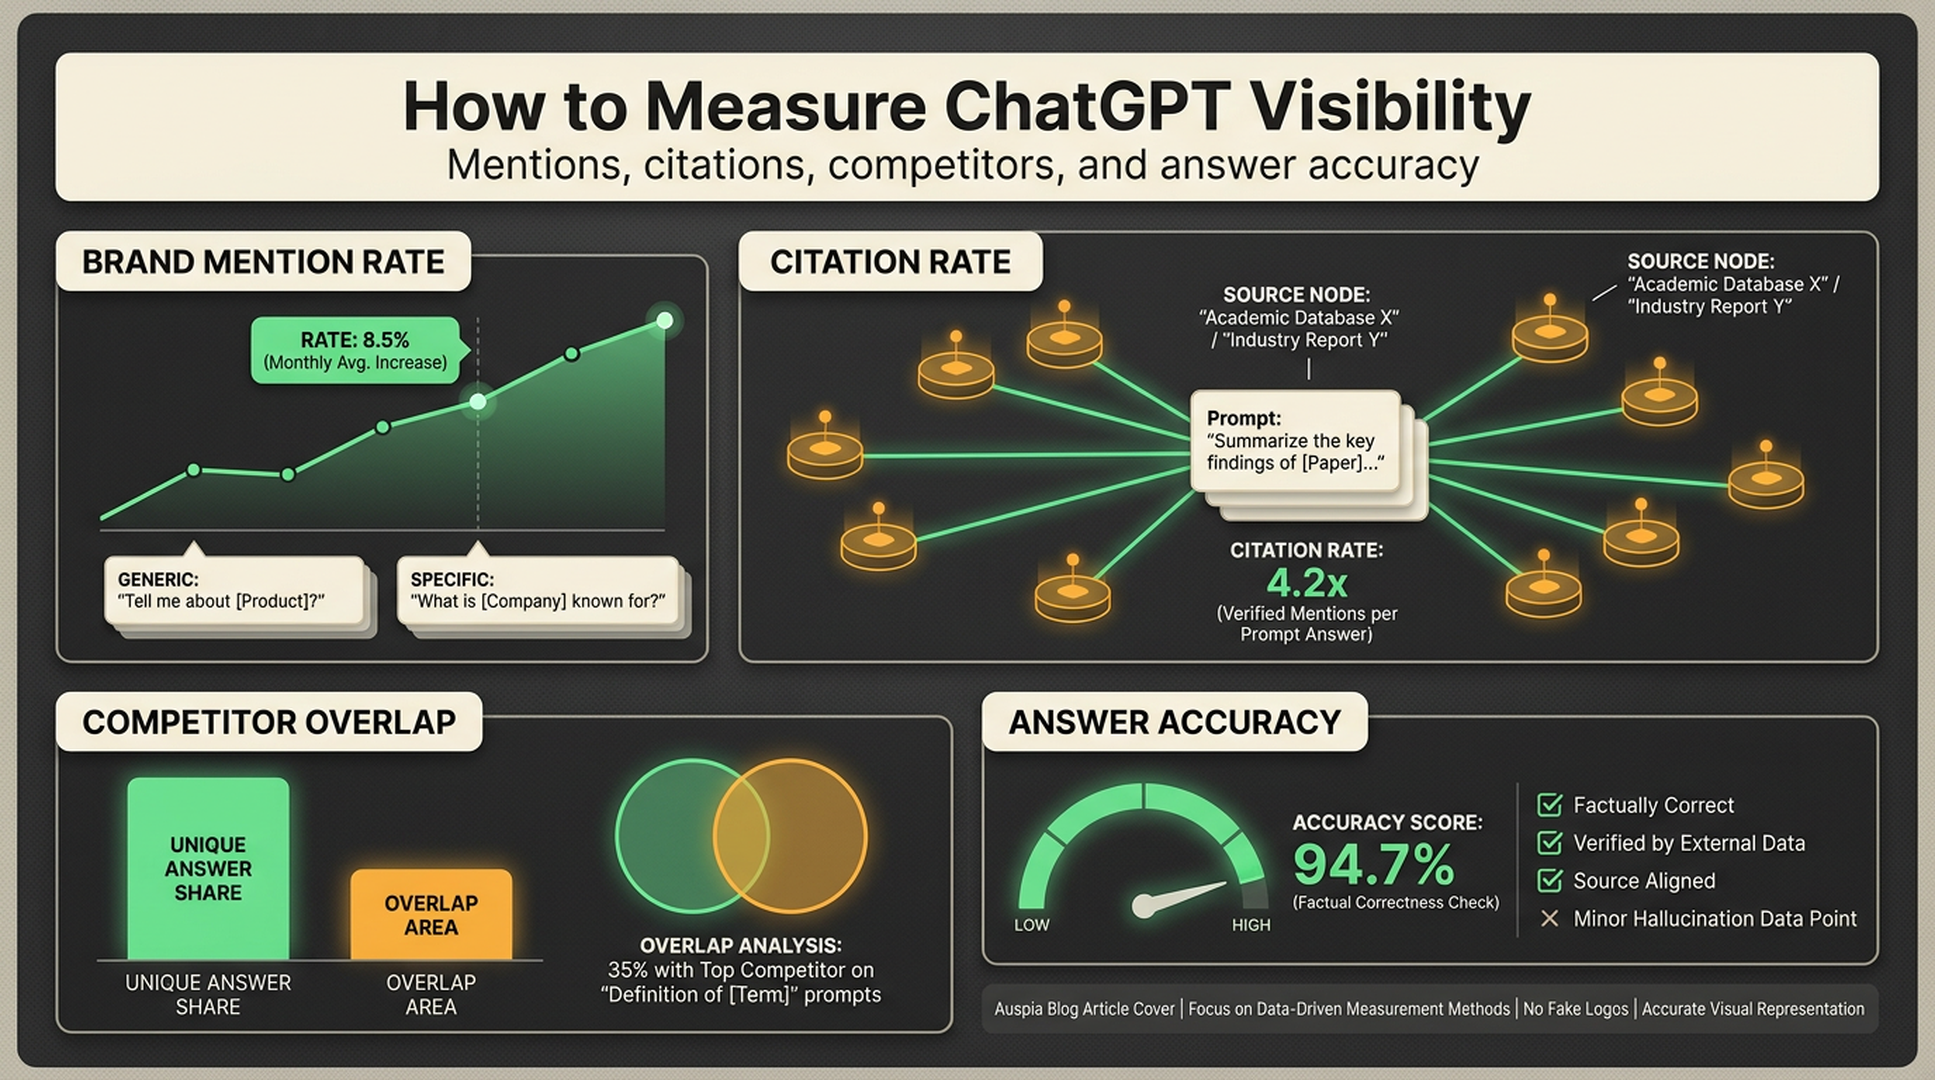
| Do answer systems describe us correctly? | Public-fact, page, and source corrections | Repeatable local buyer prompts, answer captures, cited-source log, accuracy score |
| What should change next? | Ownership and budget decisions | A dated hypothesis, one or more corroborating metrics, and a named owner |
The dashboard is not a universal attribution machine. It is a decision system that makes uncertainty visible.
Put every metric in its proper lane
The first reporting error is allowing a platform interaction to become a revenue claim. Google Business Profile Performance records how people interact with a profile on Google Search and Maps. Search Console records Google Search performance. Analytics and a CRM can record sessions, conversions, and lead outcomes when implemented correctly. A rank tracker and an AI prompt log record sampled observations.
These sources answer different questions. Do not force one to answer another.
| Data source | It can tell you | It cannot prove by itself | Good use in a local dashboard |
|---|---|---|---|
| Google Business Profile Performance | Profile views, searches, calls, directions, website clicks, messages, and eligible booking activity | That a call became a qualified lead, a direction request became a visit, or a profile action created revenue | Watch demand and action trends by location; compare against operations and lead disposition |
| Google Search Console | Google Search clicks, impressions, CTR, and average position by query, page, country, device, search appearance, and date | The exact user journey after a click, revenue, or an AI-only traffic total | Find page and query movement, then check landing-page conversion and business fit |
| GA4, call tracking, booking platform, and CRM | Sessions, tracked conversion events, lead source, qualification, appointments, sales, and lost-reason patterns | Perfect attribution when tracking is missing, consent restricts data, or a caller never identifies the source | Treat qualified leads and closed business as the primary outcome layer |
| Local rank grid | A sampled ranking position for a defined keyword, geography, device, and time | What every customer sees, total market share, or lead quality | Diagnose coverage gaps and validate whether a local visibility change is broad or narrow |
| Review tracker and customer-service log | Review trend, themes, operational pain points, and response backlog | Satisfaction of silent customers or the commercial value of one review | Route recurring themes to the operating team and audit review-request compliance |
| AI prompt and citation log | Whether a platform named and described the business for a repeatable local buyer question | A platform-wide "AI rank," a universal retrieval rule, or a causal effect from one edit | Detect factual errors, missing evidence, poor customer fit, and source-correction opportunities |
Google defines a Business Profile phone-call metric as clicks on the call button, directions as requests for directions, and website clicks as clicks on the profile's website link. Those are valuable signals, but they are not a substitute for answered-call, appointment, or revenue data. Label them platform actions in the report. Keep qualified leads and closed revenue in a separate outcome row.
The measurement boundary for Google AI traffic
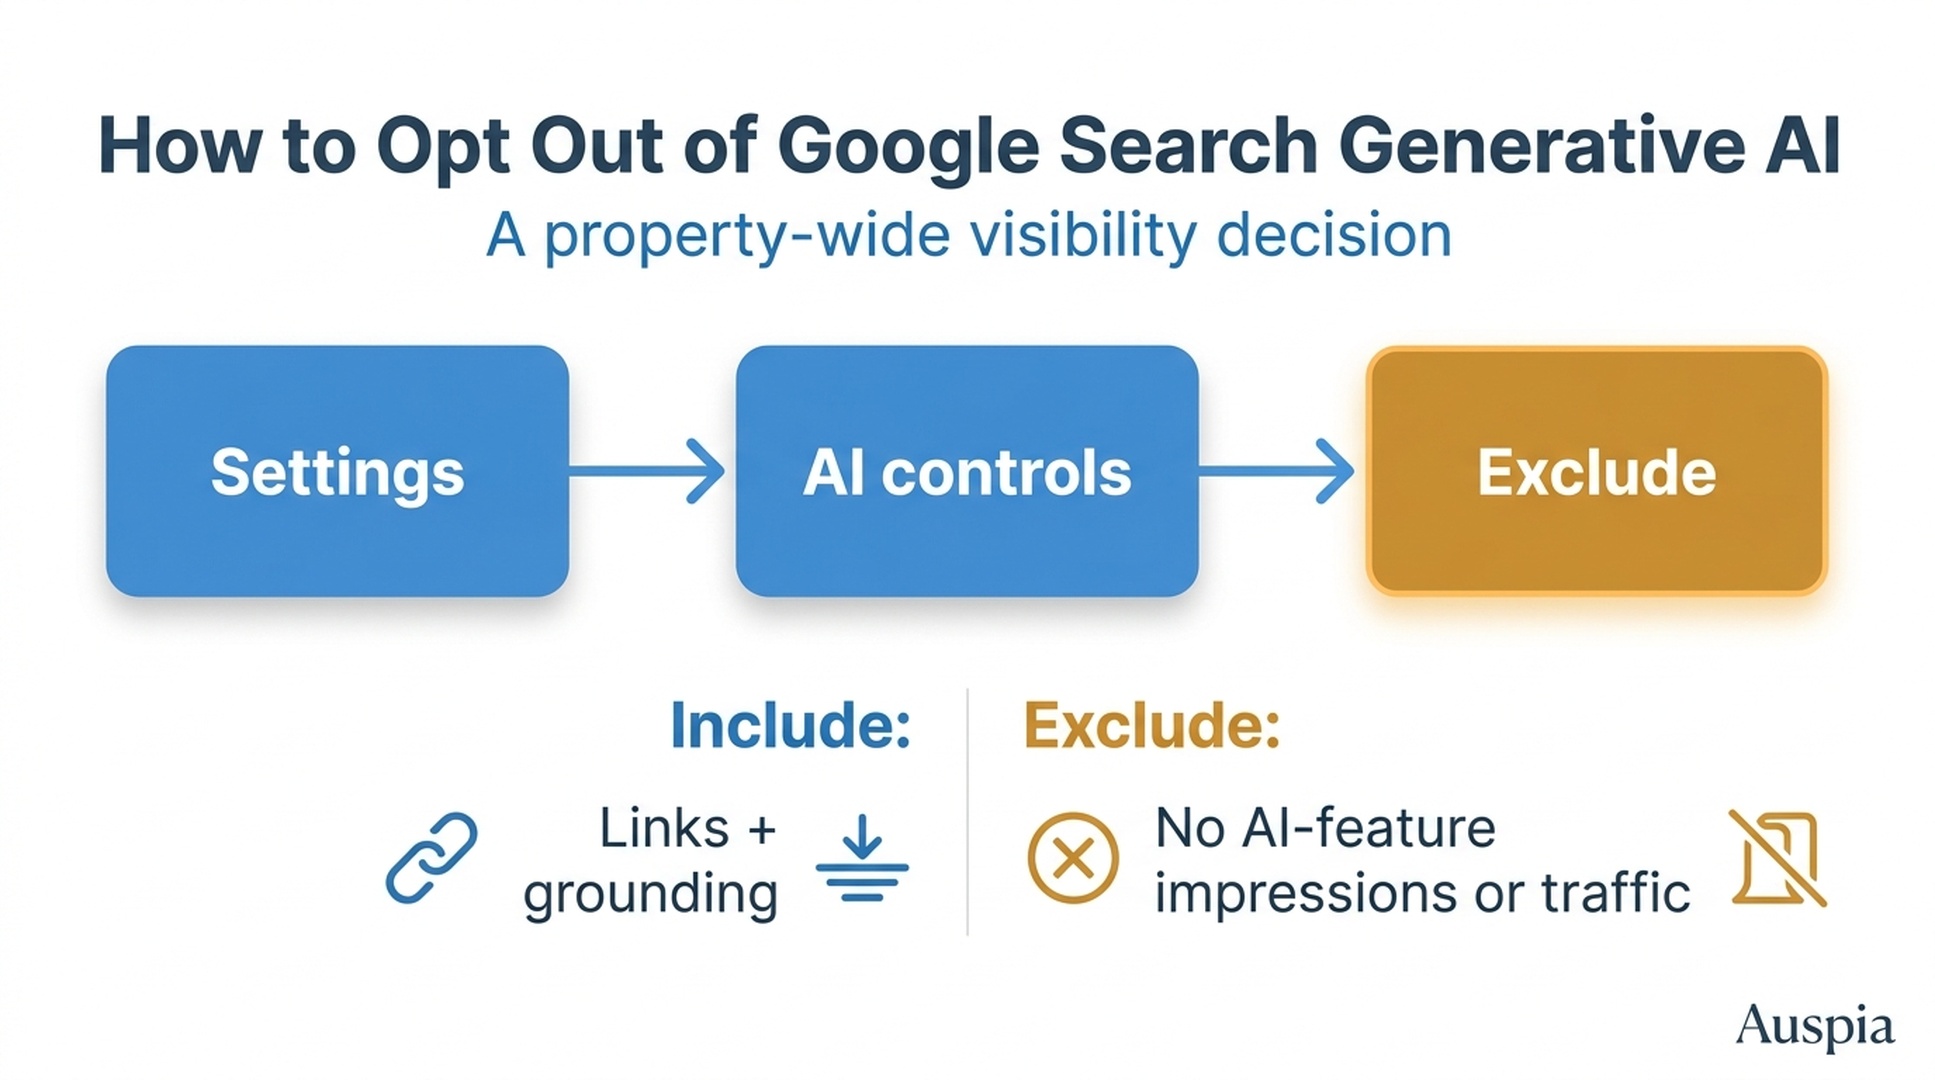
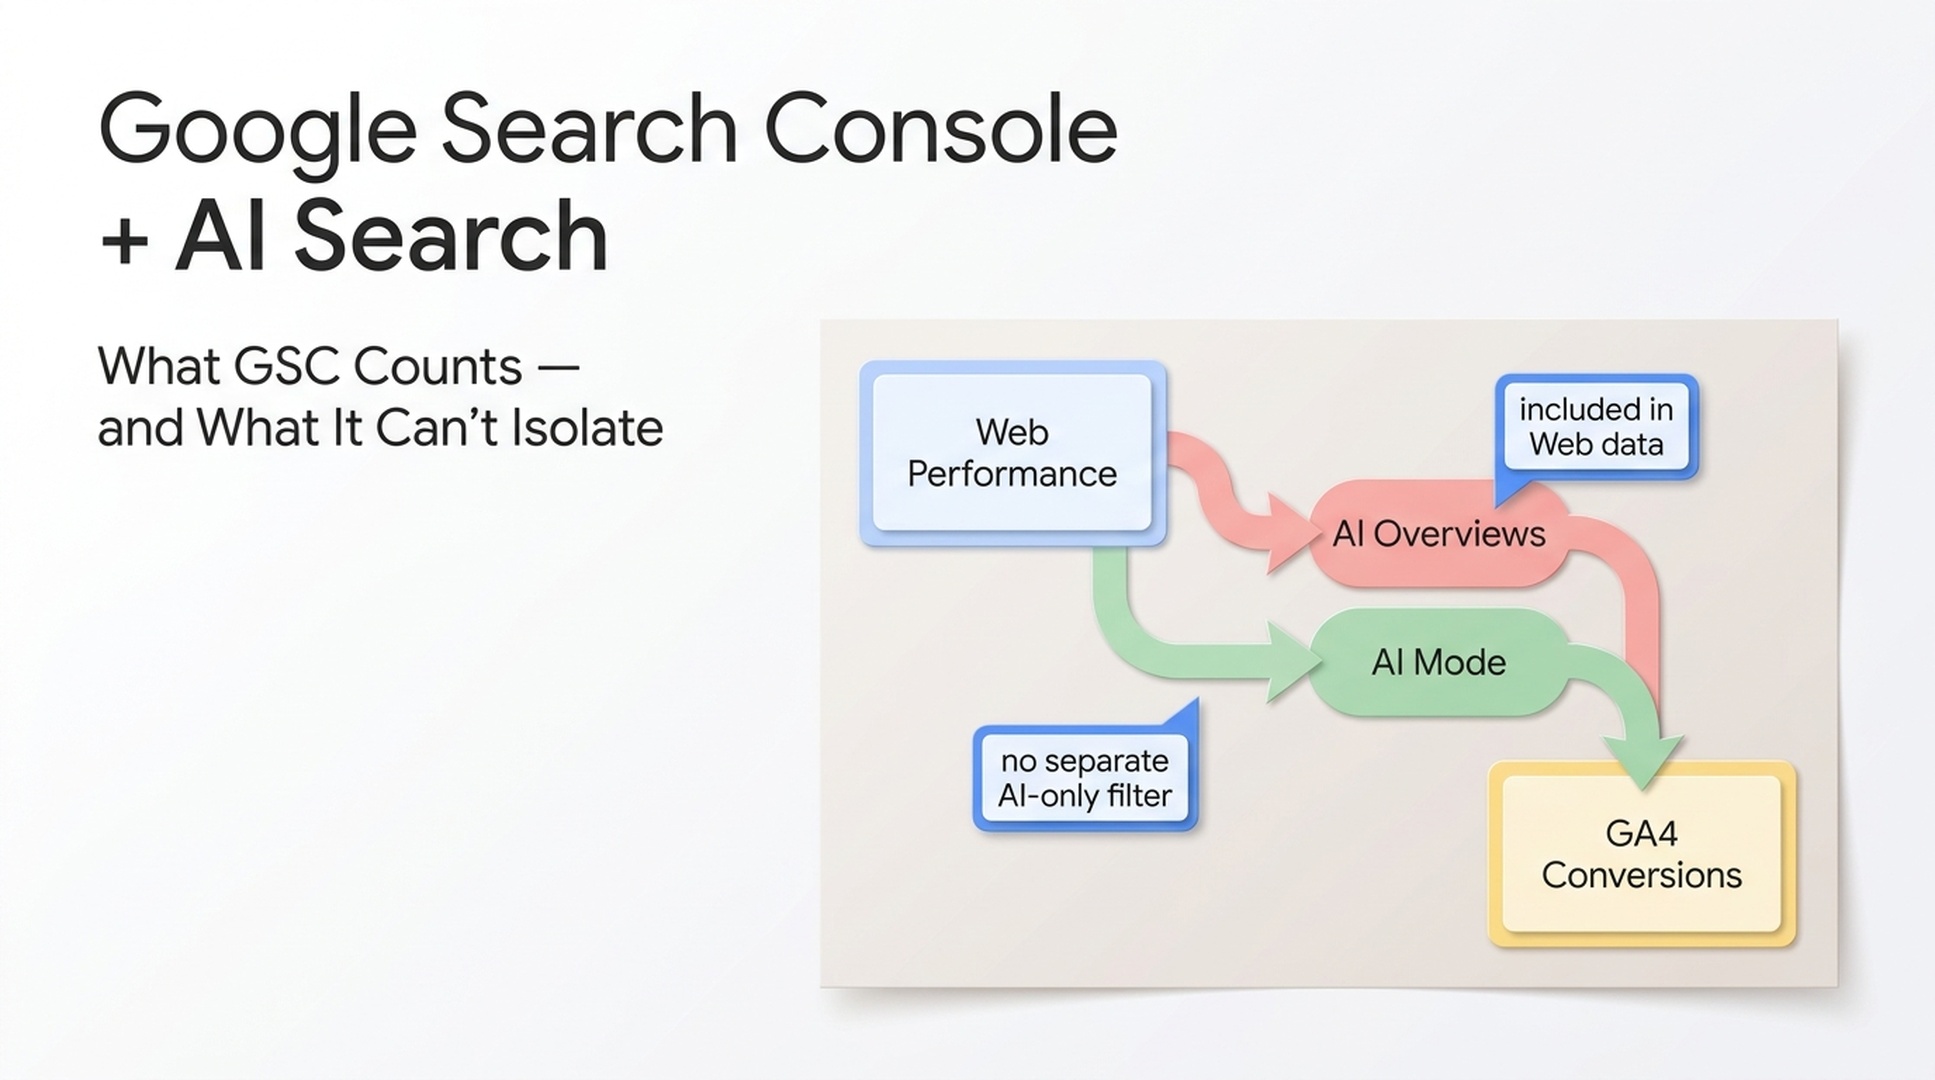
Google says that sites appearing in AI features, including AI Overviews and AI Mode, are included in overall Search traffic in Search Console's Performance report. Google does not offer a separate AI Overview or AI Mode performance report that isolates clicks and impressions for local businesses.
That produces a reporting rule worth stating plainly:
Search Console Web data can show the combined search result, including traffic from Google AI features where those features appear. It cannot prove that a particular click, impression, or conversion came from an AI Overview or AI Mode.
Use Search Console to ask practical questions: Did clicks to a local pricing explainer rise? Did impressions for a service-area query fall after a facts change? Did a new selection guide attract searchers from Canada as intended? Then use analytics and the CRM to see whether visitors engaged, requested a quote, booked, or were a good fit.
Do not calculate "AI Overview traffic" by subtracting one traffic segment from another. Do not assign a percentage of all Web clicks to AI because screenshots show an AI feature on a few queries. That creates false precision and makes later decisions harder.
Build the scorecard around outcomes, diagnostics, and observations
One executive page is usually enough if it makes the chain from demand to outcome visible. Keep the raw exports and screenshots in supporting tabs or folders. The top page should make it hard to hide a bad business result behind a good vanity metric.
| Dashboard layer | Weekly indicators | Monthly decision question | Owner |
|---|---|---|---|
| Outcome | Qualified calls, qualified forms, booked appointments, store visits where reliably measured, closed revenue, lead quality, lost reasons | Did the business get more qualified demand, and did it convert? | Sales or operations lead |
| Local discovery | Profile calls, directions, website clicks, Maps/Search views, selected grid coverage, branded and non-branded search clicks | Where did discoverability improve or weaken, and in which real market? | Local SEO lead |
| Trust and experience | New reviews, response backlog, rating context, recurring praise and complaint themes, cancellation or no-show notes | Is public reputation matching the customer experience? | Customer-experience owner |
| Owned-content health | Search Console page/query movement, indexability, local-page conversion, key fact freshness | Does the site answer the questions that create qualified actions? | Content and web owner |
| AI answer quality | Prompt-set coverage, accurate mentions, wrong facts, cited-source issues, useful next steps | Are answer systems giving buyers a correct, qualified path? | GEO or research owner |
| Learning log | Tests, facts changed, review-process changes, page releases, call-routing changes, seasonality and outages | What changed, what evidence supports a result, and what remains uncertain? | Program owner |
Use counts and rates together. Twenty qualified leads from 100 tracked calls means something different from 20 qualified leads from 30 calls. A rating also needs context: five new reviews may look positive while all five complain about delayed callbacks. Keep a short narrative below each metric so the team knows what it is looking at.
Suggested minimum fields
The smallest durable setup is more useful than a beautiful dashboard no one updates. For each location or service area, record:
- reporting period and any comparison period;
- operating context, including holidays, weather disruption, staffing changes, promotions, or service-area changes;
- Business Profile actions by location;
- website and Search Console data for priority pages and queries;
- tracked leads classified as qualified, unqualified, booked, won, lost, or pending;
- review count, response status, and up to three recurring themes;
- 20 to 30 priority local buyer prompts, their date, answer score, and supporting sources; and
- the one decision, owner, and due date that follows from the evidence.
For a business with multiple locations, do not roll everything into a single total before checking location-level quality. A location with high directions and poor lead quality can disappear inside a network-wide average.
How to capture AI visibility without inventing an AI rank
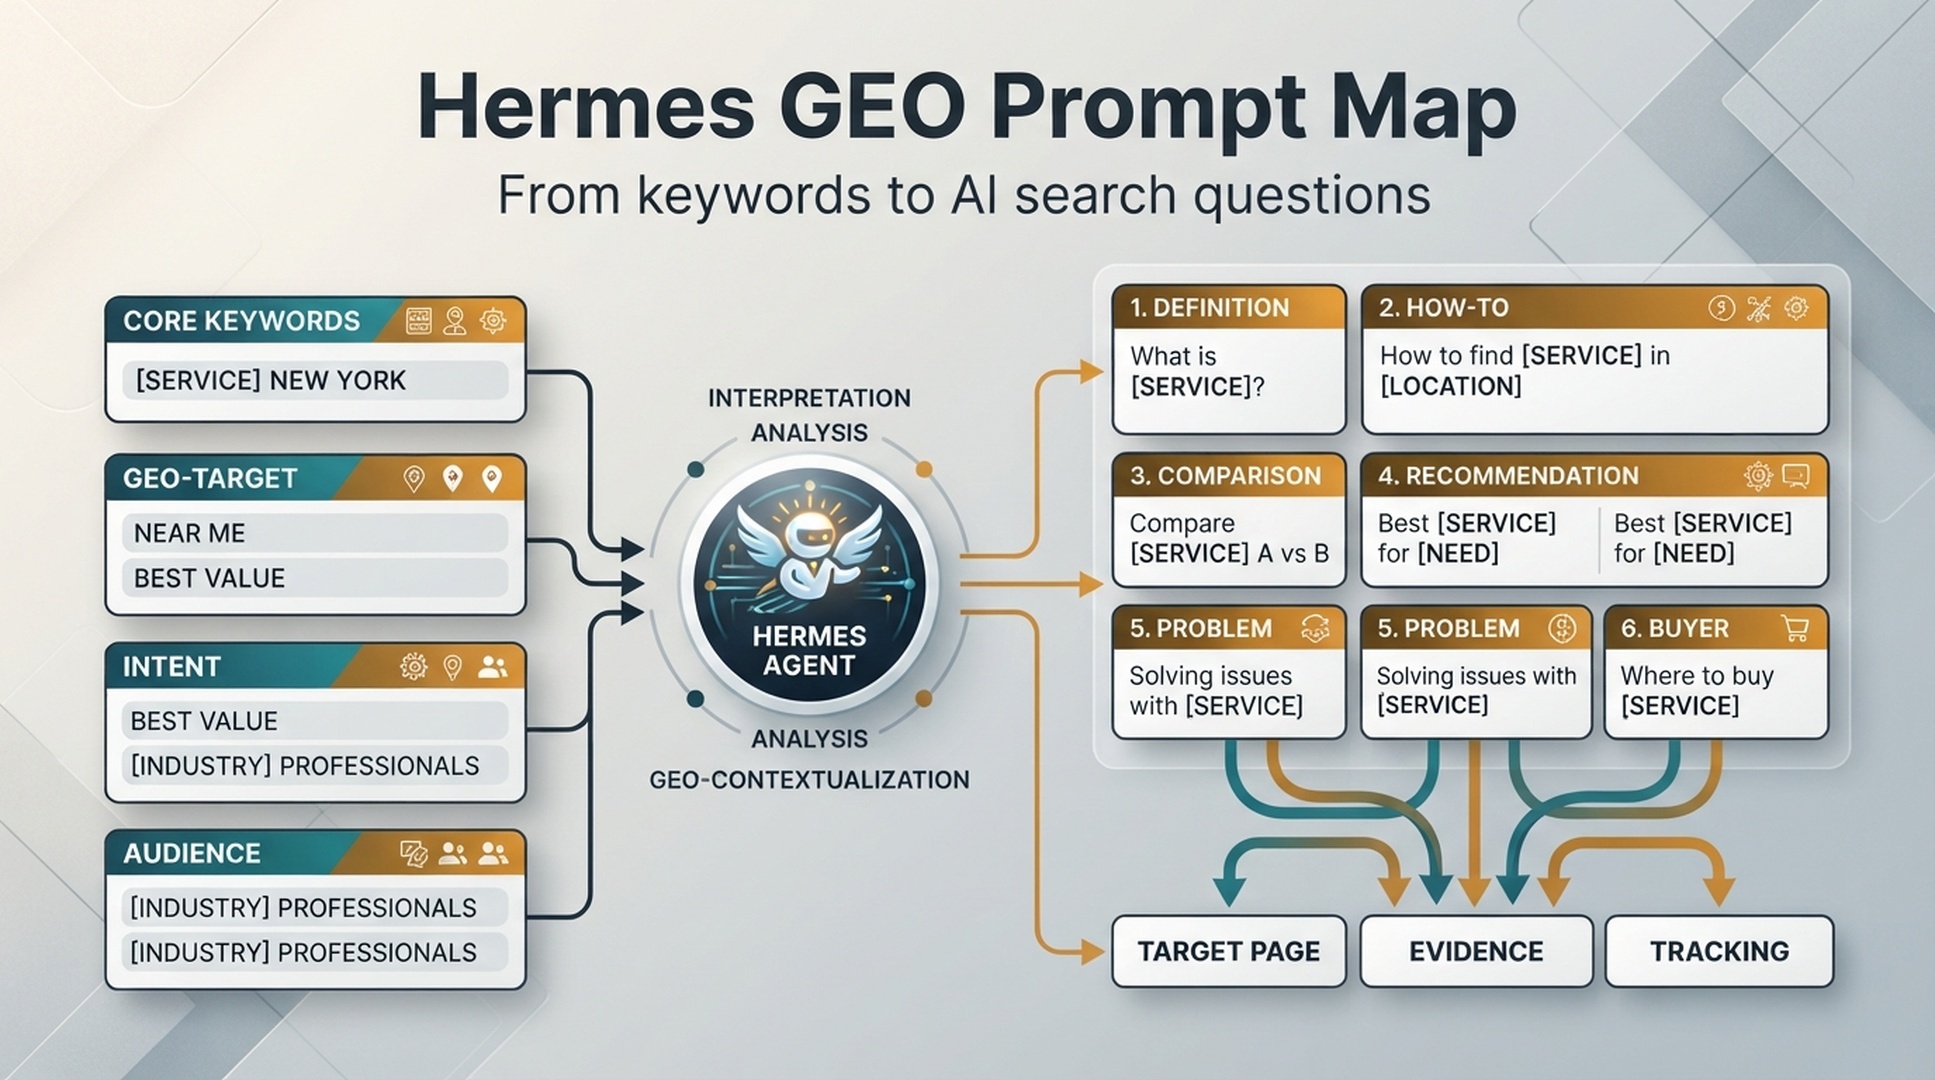
Treat the prompt log like a field notebook, not a leaderboard. Use the 20 to 30 buyer questions defined in the local GEO platform guide, but track enough context to compare one run with the next.
| Field | Example | Why it matters |
|---|---|---|
| Prompt ID and exact wording |
| A rewritten prompt is a different test |
| Buyer context | North York, urgent repair, heat pump, this week | Local recommendations change with constraint and place |
| Platform and session notes | ChatGPT search, Perplexity, Gemini, Google Search; logged-out where feasible; date and locale | Products and sessions can vary; record what the tester knows |
| Result | Named, not named, or named with caveat | Presence alone is not enough |
| Accuracy | Correct service, location, availability, and qualifications | A wrong mention can create bad leads or reputation risk |
| Evidence and next step | Visible sources, links, quoted facts, directions, phone, or booking path | Reveals whether an answer helps a suitable buyer act |
| Score and issue route | 0 to 4 plus | Turns a screenshot into an assigned correction |
Use the same five-point scoring rubric across the set:
| Score | Interpretation |
|---|---|
| 0 | Not named, or the answer is materially wrong about the business |
| 1 | Named but wrong on a service, location, fit, availability, or next step |
| 2 | Named accurately but without helpful evidence or a usable customer path |
| 3 | Accurate and supported by relevant evidence or sources |
| 4 | Accurate, well-fitted to the buyer, and directs a qualified customer to a useful next step |
This is an internal observation score, not a claim about the platform's ranking algorithm. A score of 4 for one prompt does not mean first place across AI search. It means the observed answer did a good job for that buyer question on that check.
Read conflicting signals before deciding what to fix
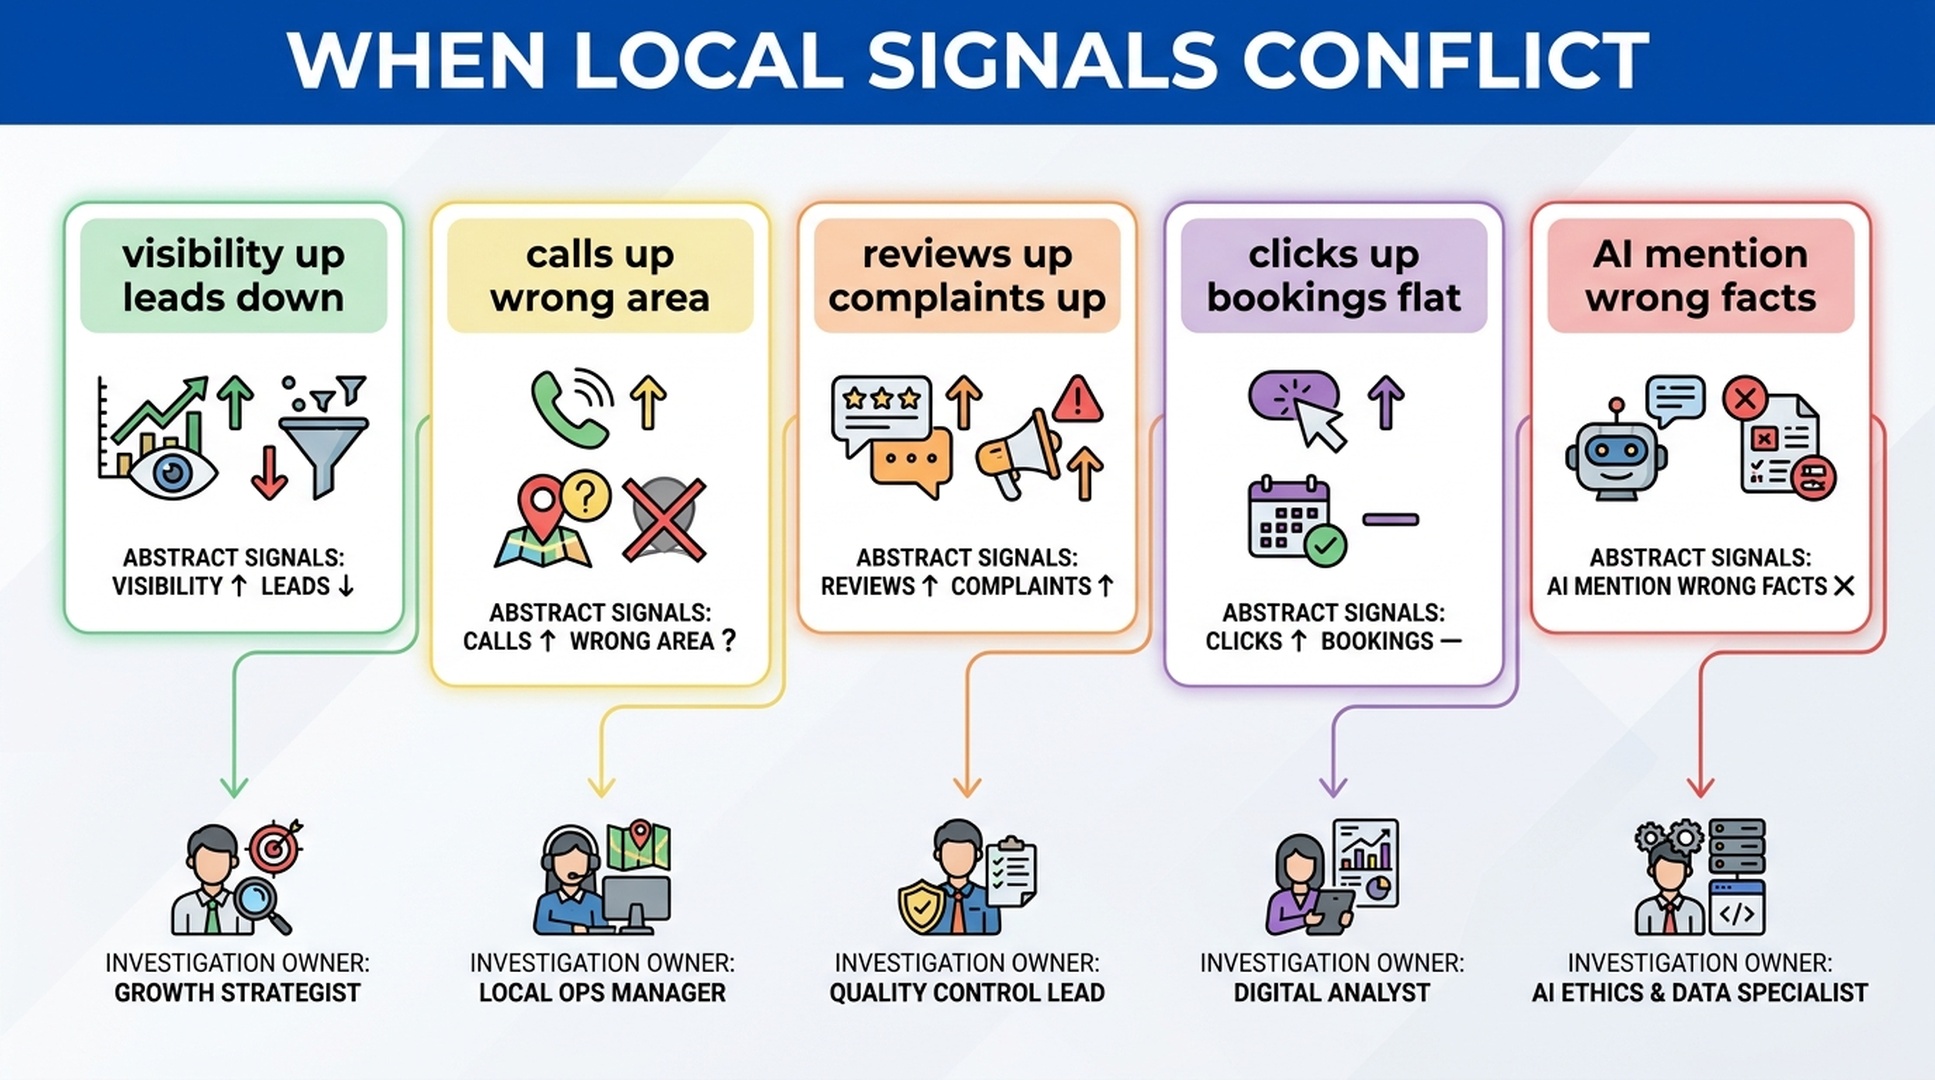
Conflicting metrics are where the dashboard earns its keep. A weak report explains them away. A useful one makes them the next investigation.
| What the report shows | Do not conclude | Better investigation | Likely next action |
|---|---|---|---|
| Maps visibility rises, qualified leads fall | "Visibility is working; sales just need to close harder" | Check query intent, rank-grid locations, call recordings or dispositions, service boundaries, landing pages, and business hours | Tighten category, service, location, and booking information; remove poor-fit paths before buying more exposure |
| Profile calls rise, but many callers are outside the service boundary | "Calls are up" | Separate answered, qualified, unqualified, missed, and after-hours calls; review service-area wording and call scripts | Clarify coverage in the profile, local pages, and phone flow; adjust staffing or routing |
| Reviews increase while the same complaint theme grows | "Reputation improved" | Tag reviews and customer-service records by theme; inspect response time and operational root cause | Fix the service failure first; respond factually and adapt the review request point if it prompts too early |
| Search Console clicks rise, bookings stagnate | "SEO produced more demand" | Compare query intent, landing pages, page speed, form errors, booking availability, device mix, and lead disposition | Improve the page's fit statement and conversion path; do not publish more of the same page type yet |
| AI mentions rise, but the business is described inaccurately | "GEO is succeeding" | Log the exact wrong fact and every visible source; confirm the operational truth | Correct the authoritative owned and third-party source, then re-test the same prompt later |
| Rank-grid coverage falls while qualified leads hold or rise | "The campaign failed" | Check market mix, branded demand, referrals, reviews, business hours, and changes to the tracked query set | Preserve outcome gains; investigate whether the grid is tracking the right queries and geography |
There is no automatic answer to these conflicts. The point is to stop a channel metric from ending the discussion. A local SEO lead should be able to say, "We saw 18% more profile call-button clicks, but qualified calls were flat because the added demand came from an excluded area." That is a more useful result than a green arrow.
The 30-day operating cadence
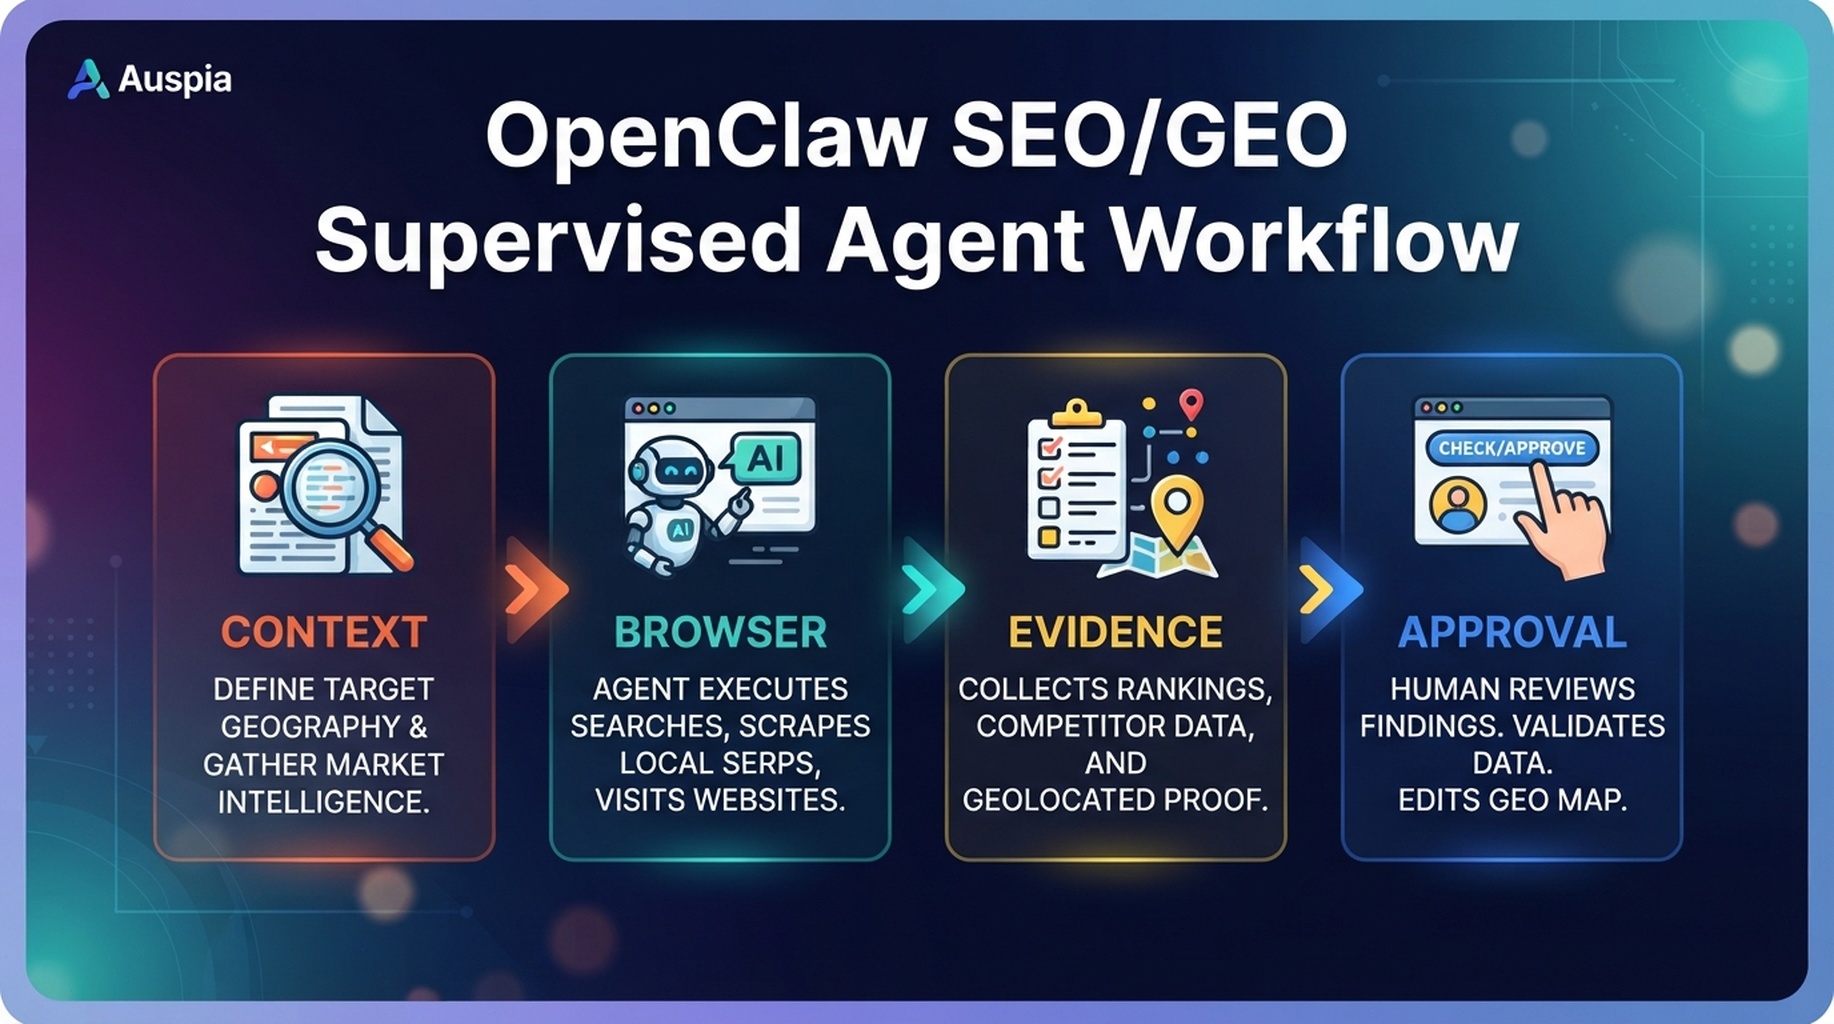
This is not a 30-day ranking guarantee. It is a short, repeatable cycle for establishing a trustworthy baseline, fixing clear public-information problems, and learning which changes deserve more investment.
| Timing | Work | Deliverable | Decision gate |
|---|---|---|---|
| Days 1-3: establish the baseline | Confirm locations, service boundaries, hours, categories, booking routes, tracking access, and CRM lead labels. Export the prior 28 to 90 days where seasonality permits. | Baseline sheet and data-owner map | Do not compare metrics until definitions and tracking gaps are documented |
| Days 4-7: audit customer paths | Test calls, forms, directions, booking, priority pages, Business Profile facts, and review response workflow. Record breaks and false claims. | Customer-path defect list | Fix conversion or factual defects before measuring content volume |
| Week 2: run the first evidence review | Capture the priority prompt set; review priority queries and local pages; tag review and lost-lead themes. | Dated answer log and issue backlog | Route each issue to the source most able to correct it |
| Week 3: make focused corrections | Update verified business facts, profile information, useful page content, high-decision citations, call routing, or service scripts. Note exactly what changed. | Change log with owners and dates | Do not bundle dozens of edits if the team hopes to learn from the result |
| Week 4: compare and decide | Review outcome, discovery, trust, content, and answer-quality layers together. Re-run affected prompts and check whether any change correlates with a meaningful improvement. | One-page decision memo and next 30-day backlog | Scale, revise, hold, or stop based on qualified outcomes and evidence strength |
For seasonal businesses, compare against the same season or a known demand pattern when possible. A snowstorm, a holiday weekend, a staffing shortage, or a regional news event can move local demand more than a page edit. Record the context rather than claiming credit by default.
What should never appear as a standalone success metric
Some numbers are still useful. They just need a companion metric and a decision context.
| Do not report this alone | Pair it with | Why |
|---|---|---|
| "AI rank" | Exact prompt, platform, date, local context, answer accuracy, sources, and qualified outcome where measurable | There is no universal AI rank to report across answer systems |
| One AI screenshot | Repeated checks across a fixed prompt set and a change log | One answer can vary by context, product, and time |
| Average local rank | Grid coverage, intent, Business Profile actions, and qualified leads | An average can conceal weak areas and bad-fit exposure |
| Citation count or directory count | Fact accuracy, source importance, referral quality, and customer fit | More listings do not automatically create trust or demand |
| Gross calls or form fills | Answered, qualified, booked, won, and lost outcomes | Unqualified, spam, missed, or out-of-area leads distort the result |
| Review count or star rating | Review themes, response quality, cancellations, repeat business, and operations issues | A high average rating can hide a recurring service failure |
| Search Console clicks | Landing-page behavior, tracked conversion, and CRM quality | Clicks show discovery, not commercial value |
This is also where agencies should be candid with clients. If call tracking does not distinguish qualified leads, say so. If a booking provider hides completed bookings, flag it. If an AI platform does not expose reliable local analytics, report observed answer quality and leave the causal claim open.
A short decision memo is the dashboard's real output
At the end of each month, write no more than five lines for each priority location or service area:
- Outcome: What changed in qualified leads, bookings, or revenue? What did not change?
- Evidence: Which discovery, trust, content, and answer-quality signals support the observation?
- Context: What operational, seasonal, tracking, or market event could explain the movement?
- Decision: What will be scaled, fixed, paused, or investigated next?
- Owner and date: Who is accountable, and when will the team review it again?
Example: "Qualified same-day repair calls in Mississauga rose from 14 to 21. Profile call-button clicks rose, but the stronger evidence is that the call team marked 17 as in-boundary and seven booked. The emergency page clarified its dispatch zone on July 12, and weekend staffing returned on July 15, so the page cannot take all the credit. Keep the page, audit weekend call routing, and repeat the urgent-repair prompt set on August 1. Owner: operations manager."
That kind of note is modest, but it is decision-ready. It also preserves the evidence a team will need when performance changes again.
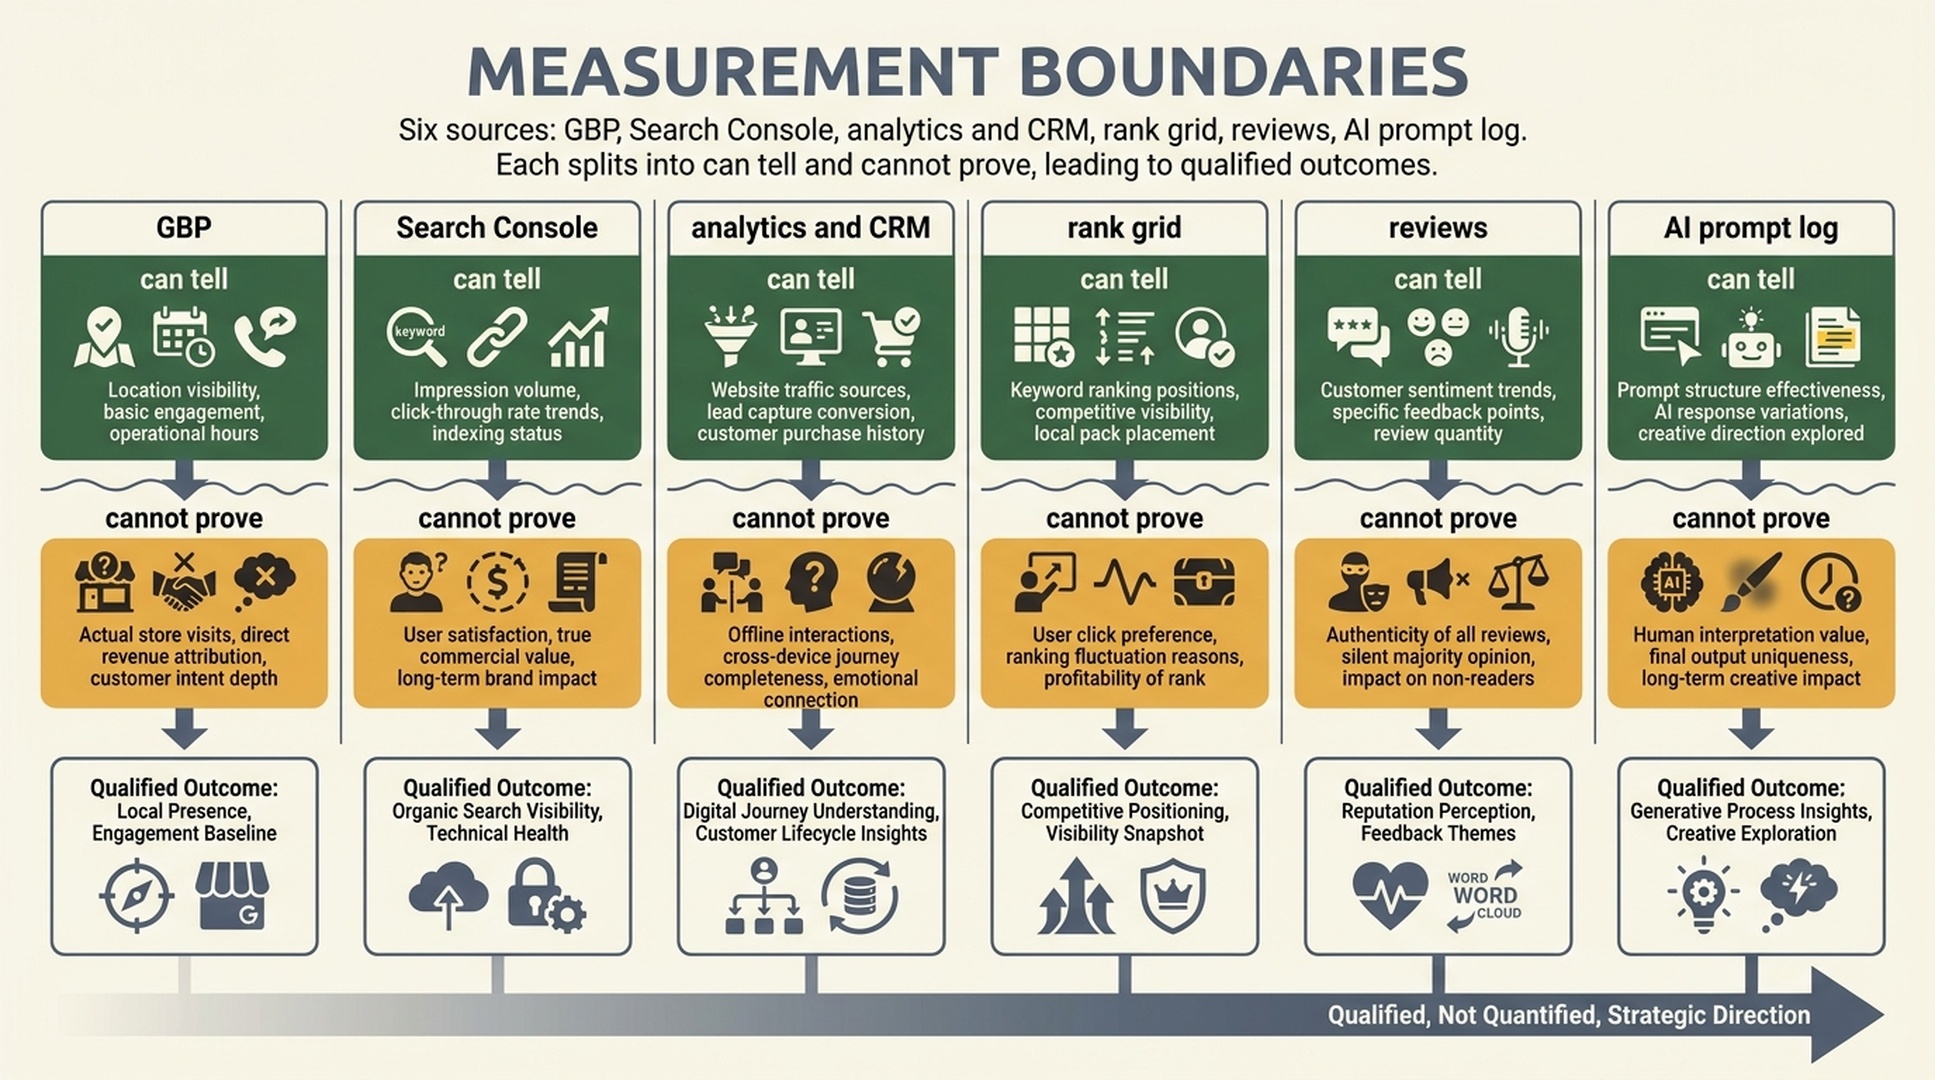
Use this framework to separate operational facts, customer trust, relevant evidence, and answer-quality checks.
Use the timeline as an operating sequence, not as a ranking guarantee.
FAQ
Can Google Business Profile Performance show revenue from Maps?
No. It can show profile views and actions such as calls, directions, website clicks, messages, and eligible booking activity. A business still needs call tracking, booking records, CRM outcomes, point-of-sale data, or another operational system to determine whether those actions produced qualified leads or revenue.
Can Search Console separate AI Overview or AI Mode traffic from regular Google Search traffic?
No. Google says AI feature traffic is included in the overall Search traffic shown in Search Console's Performance report. Use the Web report alongside Analytics and conversion data, but do not label a segment as AI-only traffic when Google has not provided that report.
How often should a local business run AI prompt checks?
During an active cleanup or launch, run a small fixed prompt set weekly. Once the public facts and customer paths are stable, a monthly review is usually more useful. Re-test after material changes to locations, services, availability, hours, pages, reviews, or important third-party records.
What is the best local SEO KPI?
For most businesses, the best primary KPI is a qualified outcome that the business can define and verify: a suitable booked appointment, a qualified quote, a visit, a sale, or retained revenue. Maps actions, rankings, reviews, Search Console data, and AI mentions are supporting diagnostics that help explain or improve that outcome.
Should an agency promise a number of AI mentions or citations?
No. AI answers can vary by platform, prompt, location, user context, available sources, and time. An agency can promise a disciplined operating process: fix material public-fact problems, maintain answerable pages and credible sources, test a defined prompt set, document outcomes, and report what is observed without inventing a platform guarantee.
Continue the local search series
Use these related guides to move from diagnosis to an operating plan:
- Local search ranking factors in 2026
- Local reviews in 2026
- Local citations after AI search
- Local GEO for AI search
Sources
- Google Business Profile Help, Check the performance of your Business Profile . Source for Performance metrics across Search and Maps, including profile views, calls, directions, website clicks, messages, and booking metrics; metrics describe profile interactions, not confirmed revenue.
- Google Search Central, AI features and your website . Source for the statement that traffic from Google AI features is included in overall Search traffic in Search Console and for Google's recommendation to use Search Console alongside Analytics and conversion measurement.
- Google Search Console Help, Performance report (Search results) . Source for clicks, impressions, CTR, average position, and the query, page, country, device, search-appearance, and date dimensions available in the Performance report.
Author: Ethan Marlowe, GEO Measurement Lead Across 500+ Prompts at Auspia. Ethan writes about prompt tracking, citation reporting, local visibility dashboards, and the difference between platform activity and business outcomes.