

The 2026 SEO Reality: Five Numbers That Redefine the Playbook
If you only remember five statistics from this article, make them these:
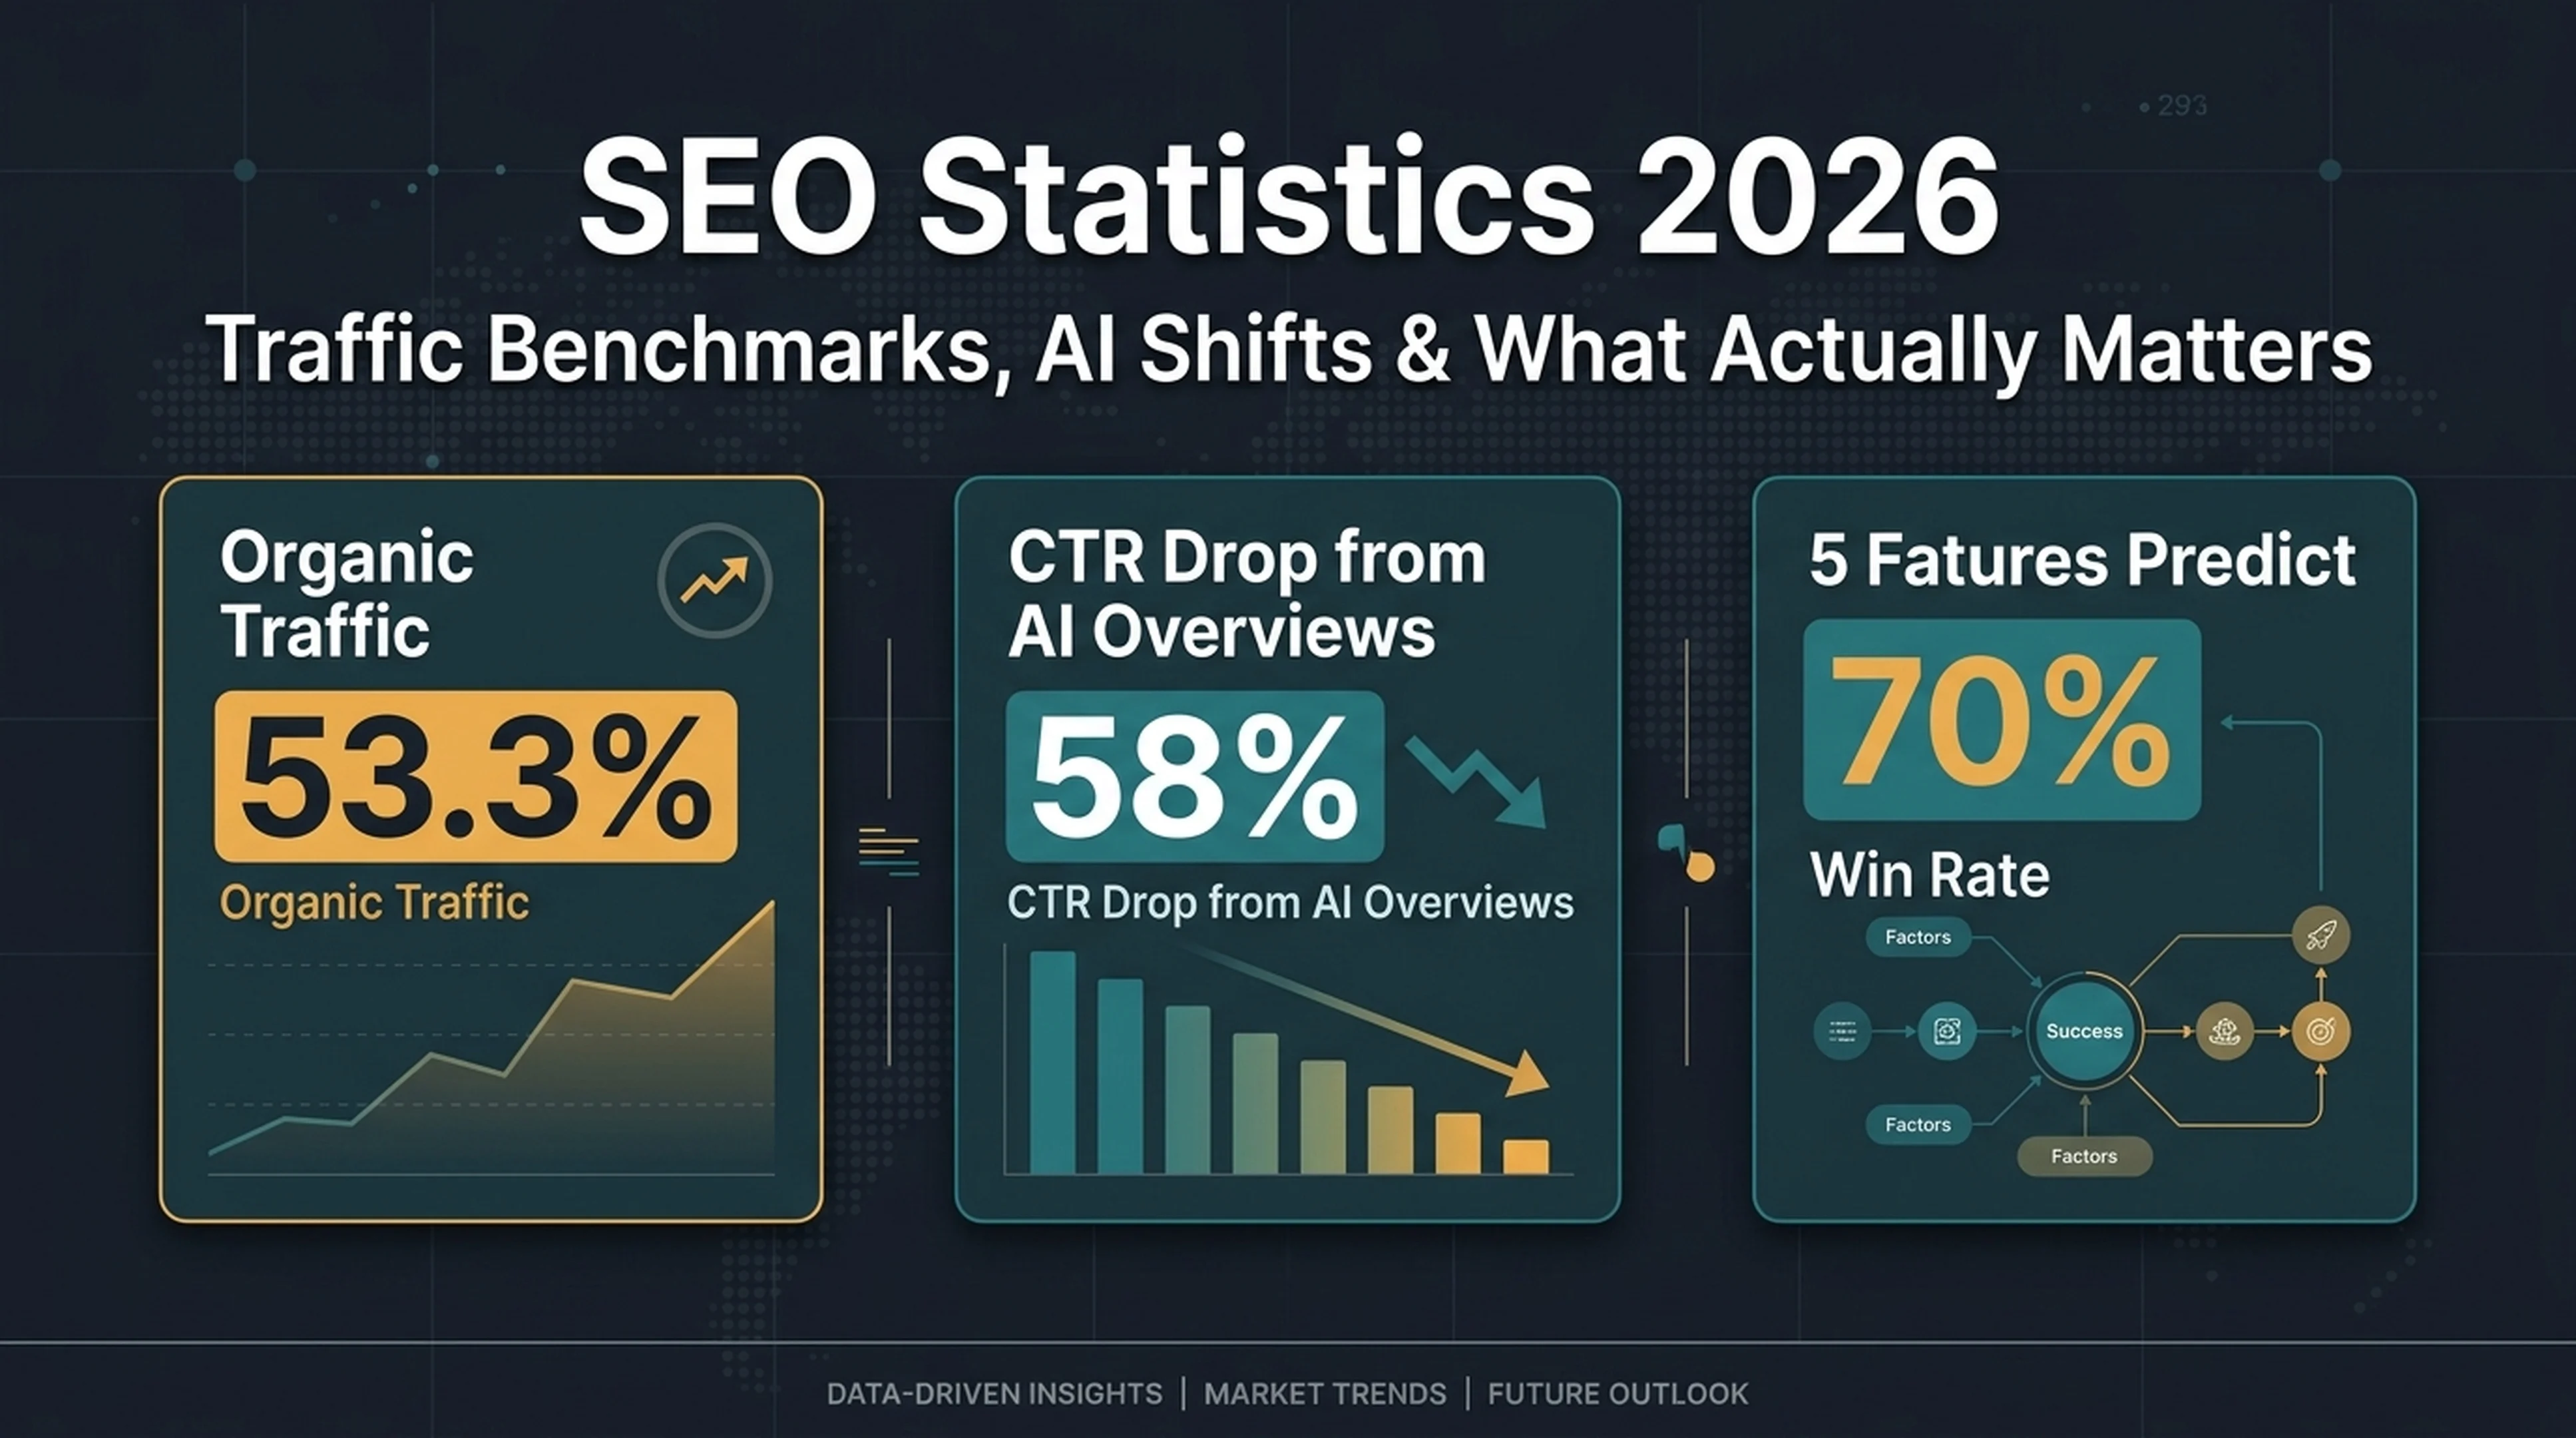
- Organic search still drives 53.3% of all website traffic — roughly 10× more than organic social media combined (BrightEdge).
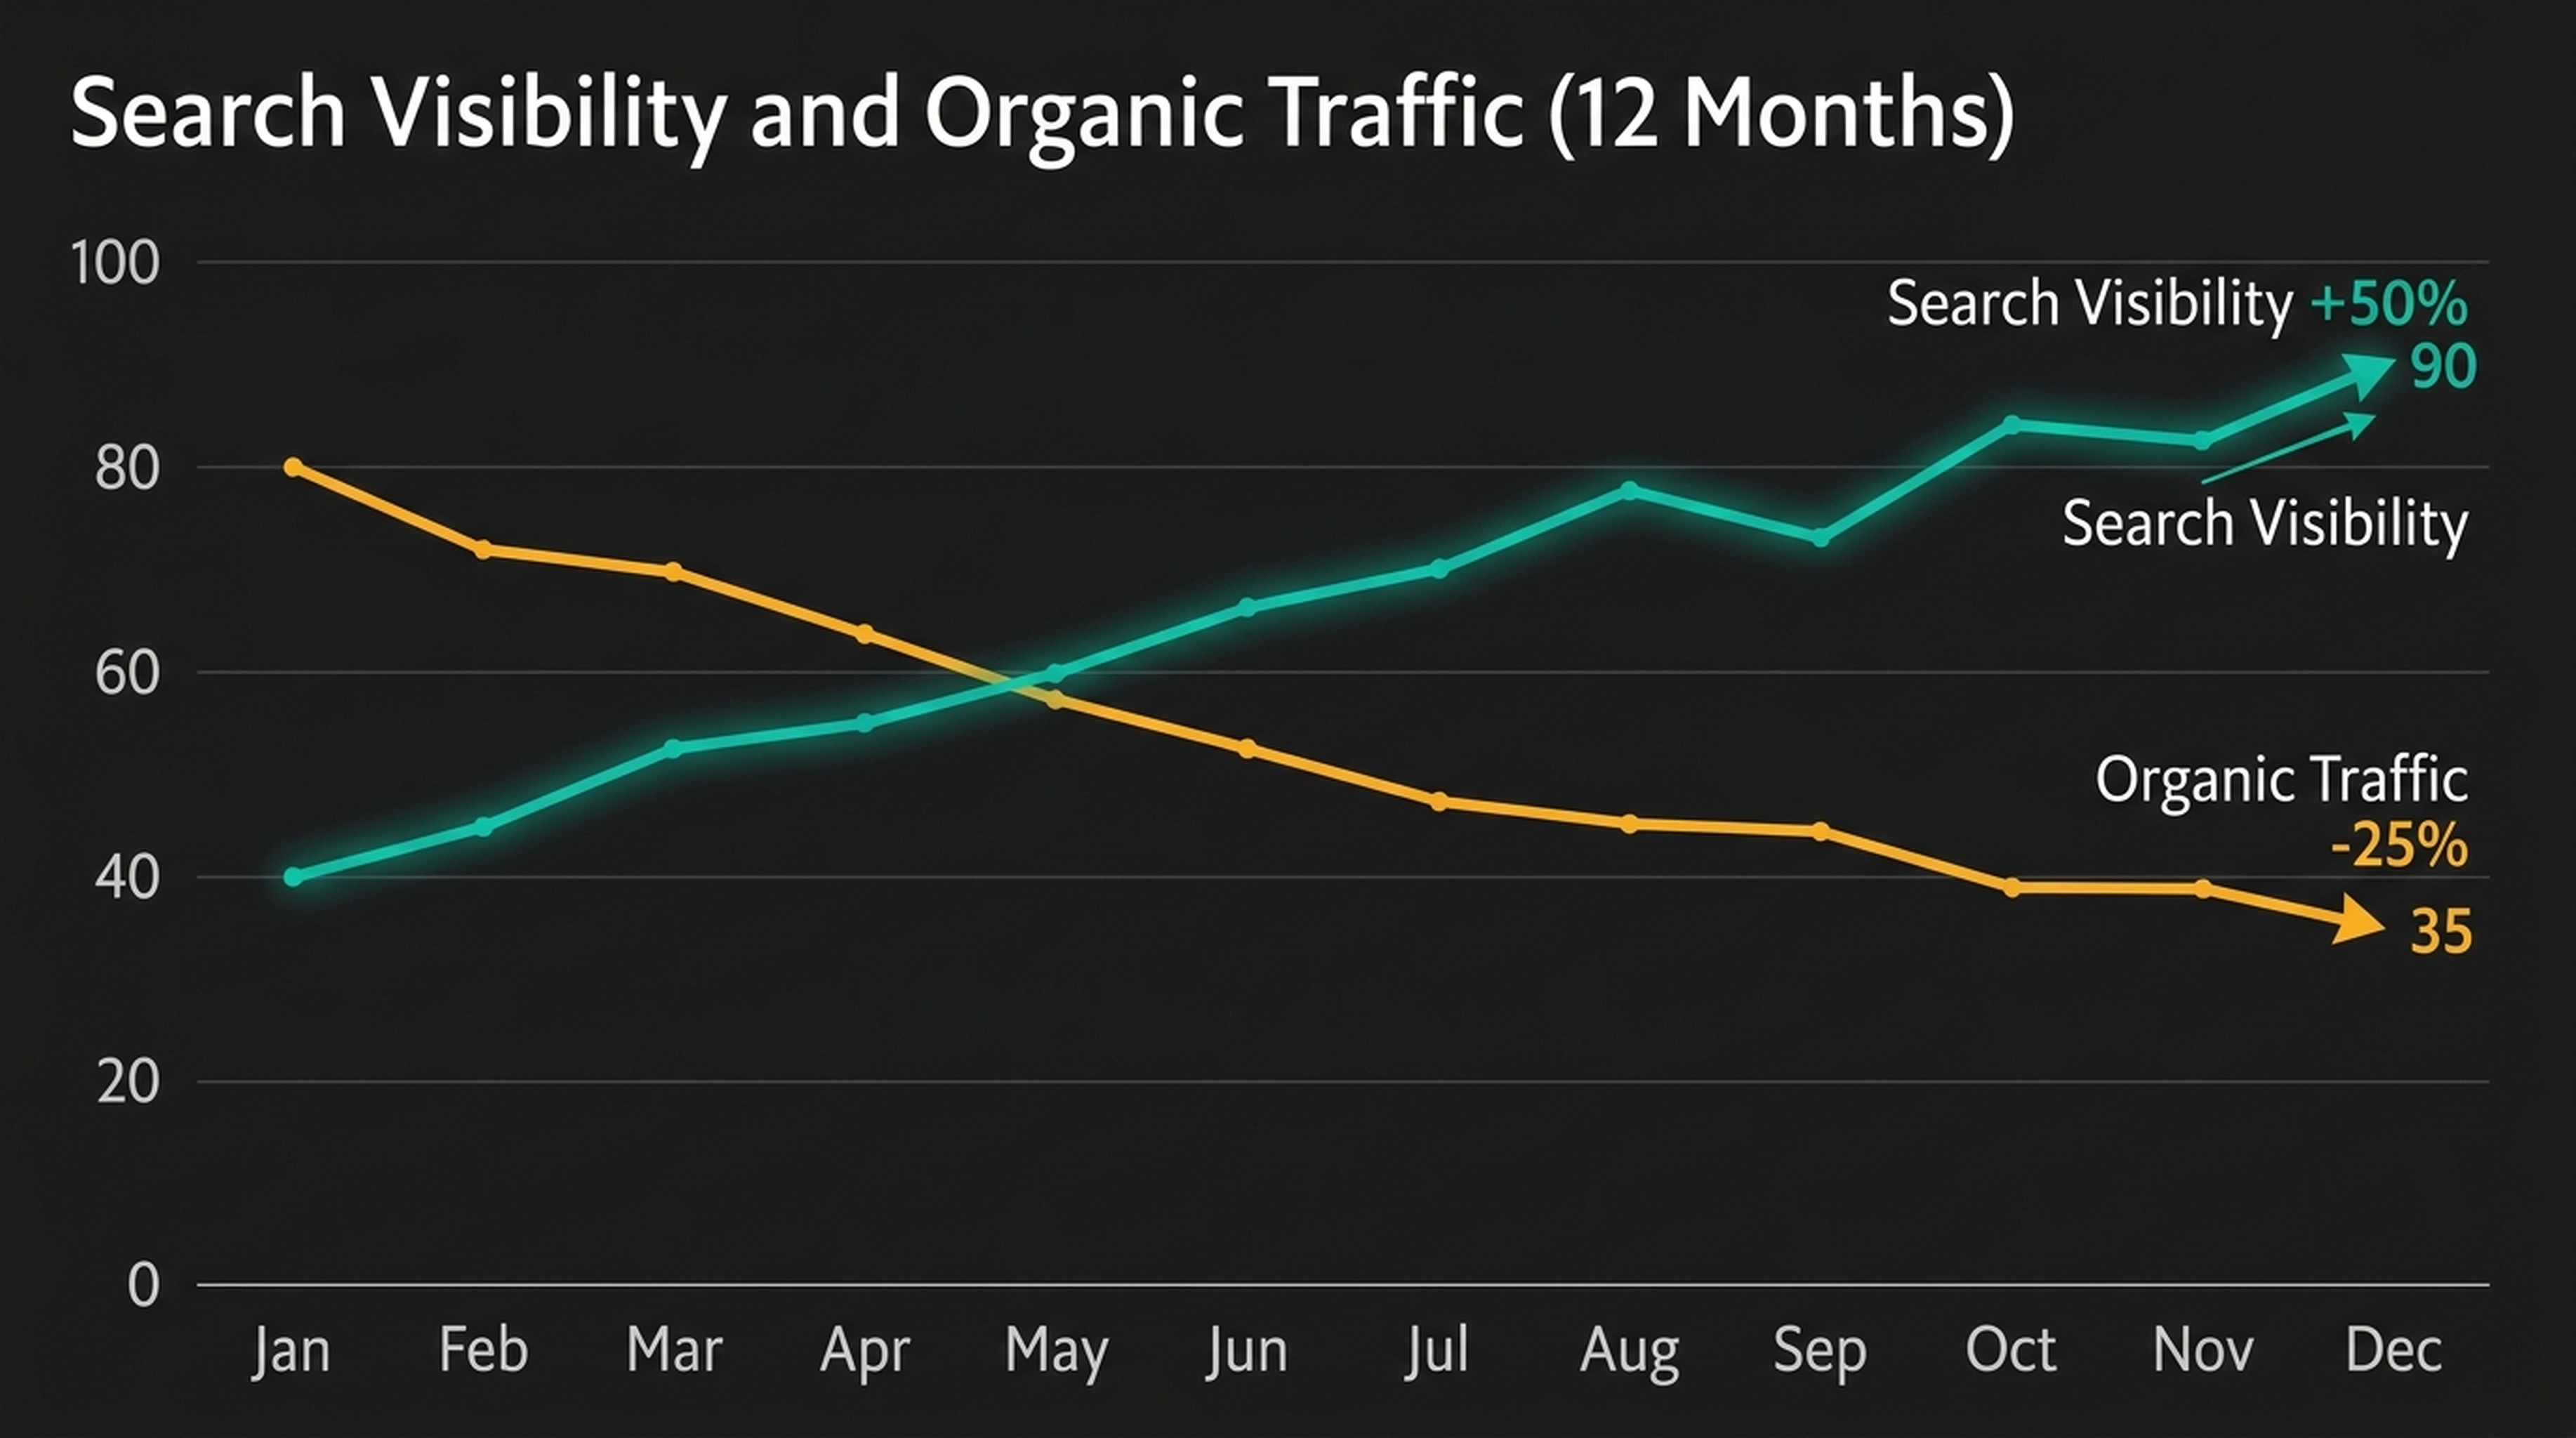
- Search visibility rose ~50% while organic traffic fell ~25% over 12 months across 210 tracked marketers. This is the central tension in 2026 SEO (Neil Patel / NP Digital, May 2026).
- AI Overviews reduce organic CTR by 58% for the top-ranking page, up from ~34.5% in early 2025. On AI Overview queries, organic CTR collapsed to 0.61% (Authoritas, Sept 2025).
- Only 5.7% of newly published pages reach the top 10 within one year — and 72.9% of top-10 pages are more than 3 years old (Ahrefs).
- Sites with 4–5 of five data-backed features had 68–70% Google traffic win rates vs. 13.5% for sites with none (Zyppy, 2026).
The numbers point in one direction: SEO in 2026 is not about publishing more content. It is about building sites that search engines treat as destinations, not information sources.
The Visibility-Traffic Divergence: Why Rankings Aren't Enough
A 12-month index tracking 210 marketers surfaces a pattern every SEO team needs to reckon with in 2026:
Metric | Direction | Magnitude |
|---|---|---|
Search visibility (impressions) | ↑ Rising | +~50% |
Organic traffic (clicks) | ↓ Falling | -~25% |
Zero-click searches (US) | ↑ Rising | 58.5% of all searches |
AI Overview presence | ↑ Rising | 15.69% of keywords |
What this means: Your pages can show up more often than ever — and get clicked less often than ever. Google is answering more queries directly on the SERP, AI Overviews are absorbing informational clicks, and only pages that offer something the SERP cannot replicate are holding onto traffic.
This is not a temporary dip. The data from mid-2025 through mid-2026 shows the gap widening, not closing. News publishers took the hardest hit: Google Web Search dropped from 51% to 27% of publisher referrals in two years.
The new rule: If an AI Overview can summarize your page in three sentences, it already has. If your page lets someone do something — calculate a price, run a tool, book a service, query proprietary data — the AI cannot replace it.
What Actually Predicts Google Traffic in 2026
Zyppy analyzed 400+ sites to find which features correlate with year-over-year Google traffic outcomes. Five features showed a measurable effect, and they stack:
Feature | Correlation with YoY Traffic | Example |
|---|---|---|
Offers a product or service | 0.391 | SaaS tools, ecommerce, service booking |
Allows task completion | 0.381 | Calculators, generators, interactive tools |
Owns proprietary assets | 0.357 | Original data, unique databases, first-party research |
Tight topical focus | 0.250 | Deep niche coverage vs. broad shallow content |
Strong brand | 0.206 | Branded search volume, entity recognition |
Win rates by feature count:
Features Present | Traffic Win Rate |
|---|---|
4–5 features | 68–70% |
2–3 features | ~40% |
0–1 feature | 13.5% |
Self-check: Score your site on each feature. Be honest. If you scored 0–1, your content-first SEO strategy needs to become a product-first strategy. Google is increasingly rewarding sites that do something a language model cannot — process a transaction, run a calculation, show proprietary data, or let a user complete a task.
Organic Traffic Benchmarks by Industry
Ahrefs analyzed 422,421 real websites in May 2026. Here are median monthly organic clicks by industry:
Industry | Median Monthly Clicks |
|---|---|
News | 175,115 |
Arts & Entertainment | 42,908 |
Internet & Telecom | 33,854 |
Shopping | 28,711 |
Business & Industrial | 28,244 |
Computers & Electronics | 23,419 |
Home & Garden | 21,837 |
Finance | 19,763 |
Health | 18,422 |
Travel | 17,631 |
Food & Drink | 16,290 |
Education | 14,873 |
Real Estate | 11,054 |
Law & Government | 8,607 |
By Domain Rating:
DR Range | Median Monthly Clicks |
|---|---|
0–10 | 11 |
11–30 | 285 |
31–50 | 4,214 |
51–70 | 28,396 |
71–90 | 88,701 |
90–100 | 126,364 |
The gap is four orders of magnitude. A DR 10 site and a DR 90 site are not playing the same game.
By site size:
Pages on Site | Median Monthly Clicks |
|---|---|
<10 | 18 |
10–100 | 554 |
101–1,000 | 8,829 |
1,001–5,000 | 56,408 |
5,000+ | 244,772 |
What this means for you: Find your industry, DR range, and site size in these tables. If you are below the median, you have a traffic problem that content volume alone will not fix — you likely need authority building, topical focus, or product/tool investment.
Organic CTR in 2026: What's Normal Now
The "good CTR" conversation needs a reset. Across all industries, a whole-site organic CTR of 1–2% is normal in 2026. If you are above 3%, you are outperforming most sites in your authority range.
CTR by industry (Ahrefs, May 2026):
Industry | Median Organic CTR |
|---|---|
Adult | 7.53% |
Arts & Entertainment | 2.84% |
Autos & Vehicles | 2.05% |
Beauty & Fitness | 1.73% |
Books & Literature | 1.59% |
Business & Industrial | 1.64% |
Computers & Electronics | 1.42% |
Finance | 1.48% |
Food & Drink | 1.92% |
Games | 1.32% |
Health | 1.12% |
Hobbies & Leisure | 2.48% |
Home & Garden | 2.21% |
Internet & Telecom | 1.65% |
Jobs & Education | 1.82% |
Law & Government | 1.04% |
News | 0.98% |
Pets & Animals | 0.80% |
Real Estate | 1.79% |
Science | 1.36% |
Shopping | 1.28% |
Sports | 1.51% |
Travel | 1.61% |
Pattern: Answer-heavy, AI-Overview-prone categories sit at the bottom — Health (1.12%), Science (1.36%), News (0.98%). Visual, action-oriented categories trend higher — Arts (2.84%), Hobbies (2.48%), Home & Garden (2.21%).
CTR by Domain Rating:
DR Range | Median CTR |
|---|---|
0–10 | 0.43% |
11–30 | 0.89% |
31–50 | 1.43% |
51–70 | 1.97% |
71–90 | 2.27% |
90–100 | 2.56% |
Position-level CTR (aggregated across studies):
SERP Position | CTR Range |
|---|---|
Position 1 | 27.6–39.8% |
Position 2 | 14.6–18.7% |
Position 3 | 10.2–11.4% |
Position 4 | 7.4–8.1% |
Position 5 | 5.1–6.2% |
Positions 6–10 | 2.2–3.8% |
Page 2 (all positions) | 0.67% combined |
The top 3 organic results capture roughly 68.7% of all clicks. Moving from position 10 to position 1 delivers roughly 10× more clicks — but only when AI Overviews are absent. When AI Overviews appear, even position 1 CTR collapses.
The AI Overview Effect: How AI Answers Reshape Click-Through
This is the section that would not have existed in a 2024 SEO statistics article. In 2026, it is the most important section.
AI Overview presence and growth:
Metric | Value | Source/Date |
|---|---|---|
Keywords triggering AI Overviews | 15.69% | Nov 2025 |
Question queries triggering AI Overviews | 57.9% | Nov 2025 |
Commercial keywords with AI Overviews | 18.57% (up from 8.15% YoY) | Oct 2025 |
YoY growth in commercial AI Overviews | +128% | Oct 2024 → Oct 2025 |
What AI Overviews do to organic CTR:
Scenario | Organic CTR Impact |
|---|---|
AI Overview present — top result | −58% CTR vs. no-AIO SERP |
AI Overview present — positions 1–3 | −41% combined CTR |
AI Overview present — informational query | 0.61% average organic CTR |
No AI Overview — same query | ~3–5× higher CTR |
AI referral traffic: the other side:
Platform | Share of AI Referral Traffic |
|---|---|
ChatGPT | ~78% |
Perplexity | ~12% |
Gemini | ~7% |
Others (Copilot, Claude, etc.) | ~3% |
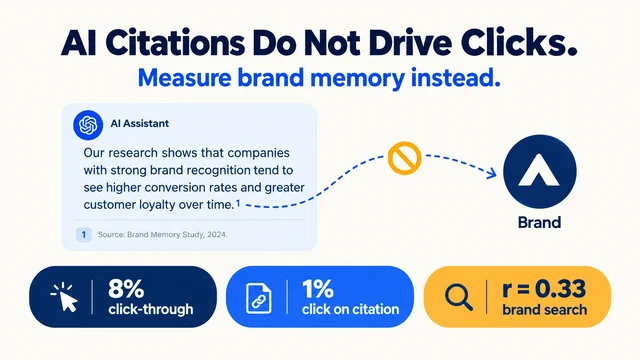
Google still sends 345× more traffic than ChatGPT, Gemini, and Perplexity combined. But the direction of travel is clear — AI platform referrals are growing from a small base while Google organic clicks face structural headwinds. And only about 1% of users click on sources cited within an AI Overview, so "being cited" and "getting clicked" are very different outcomes.
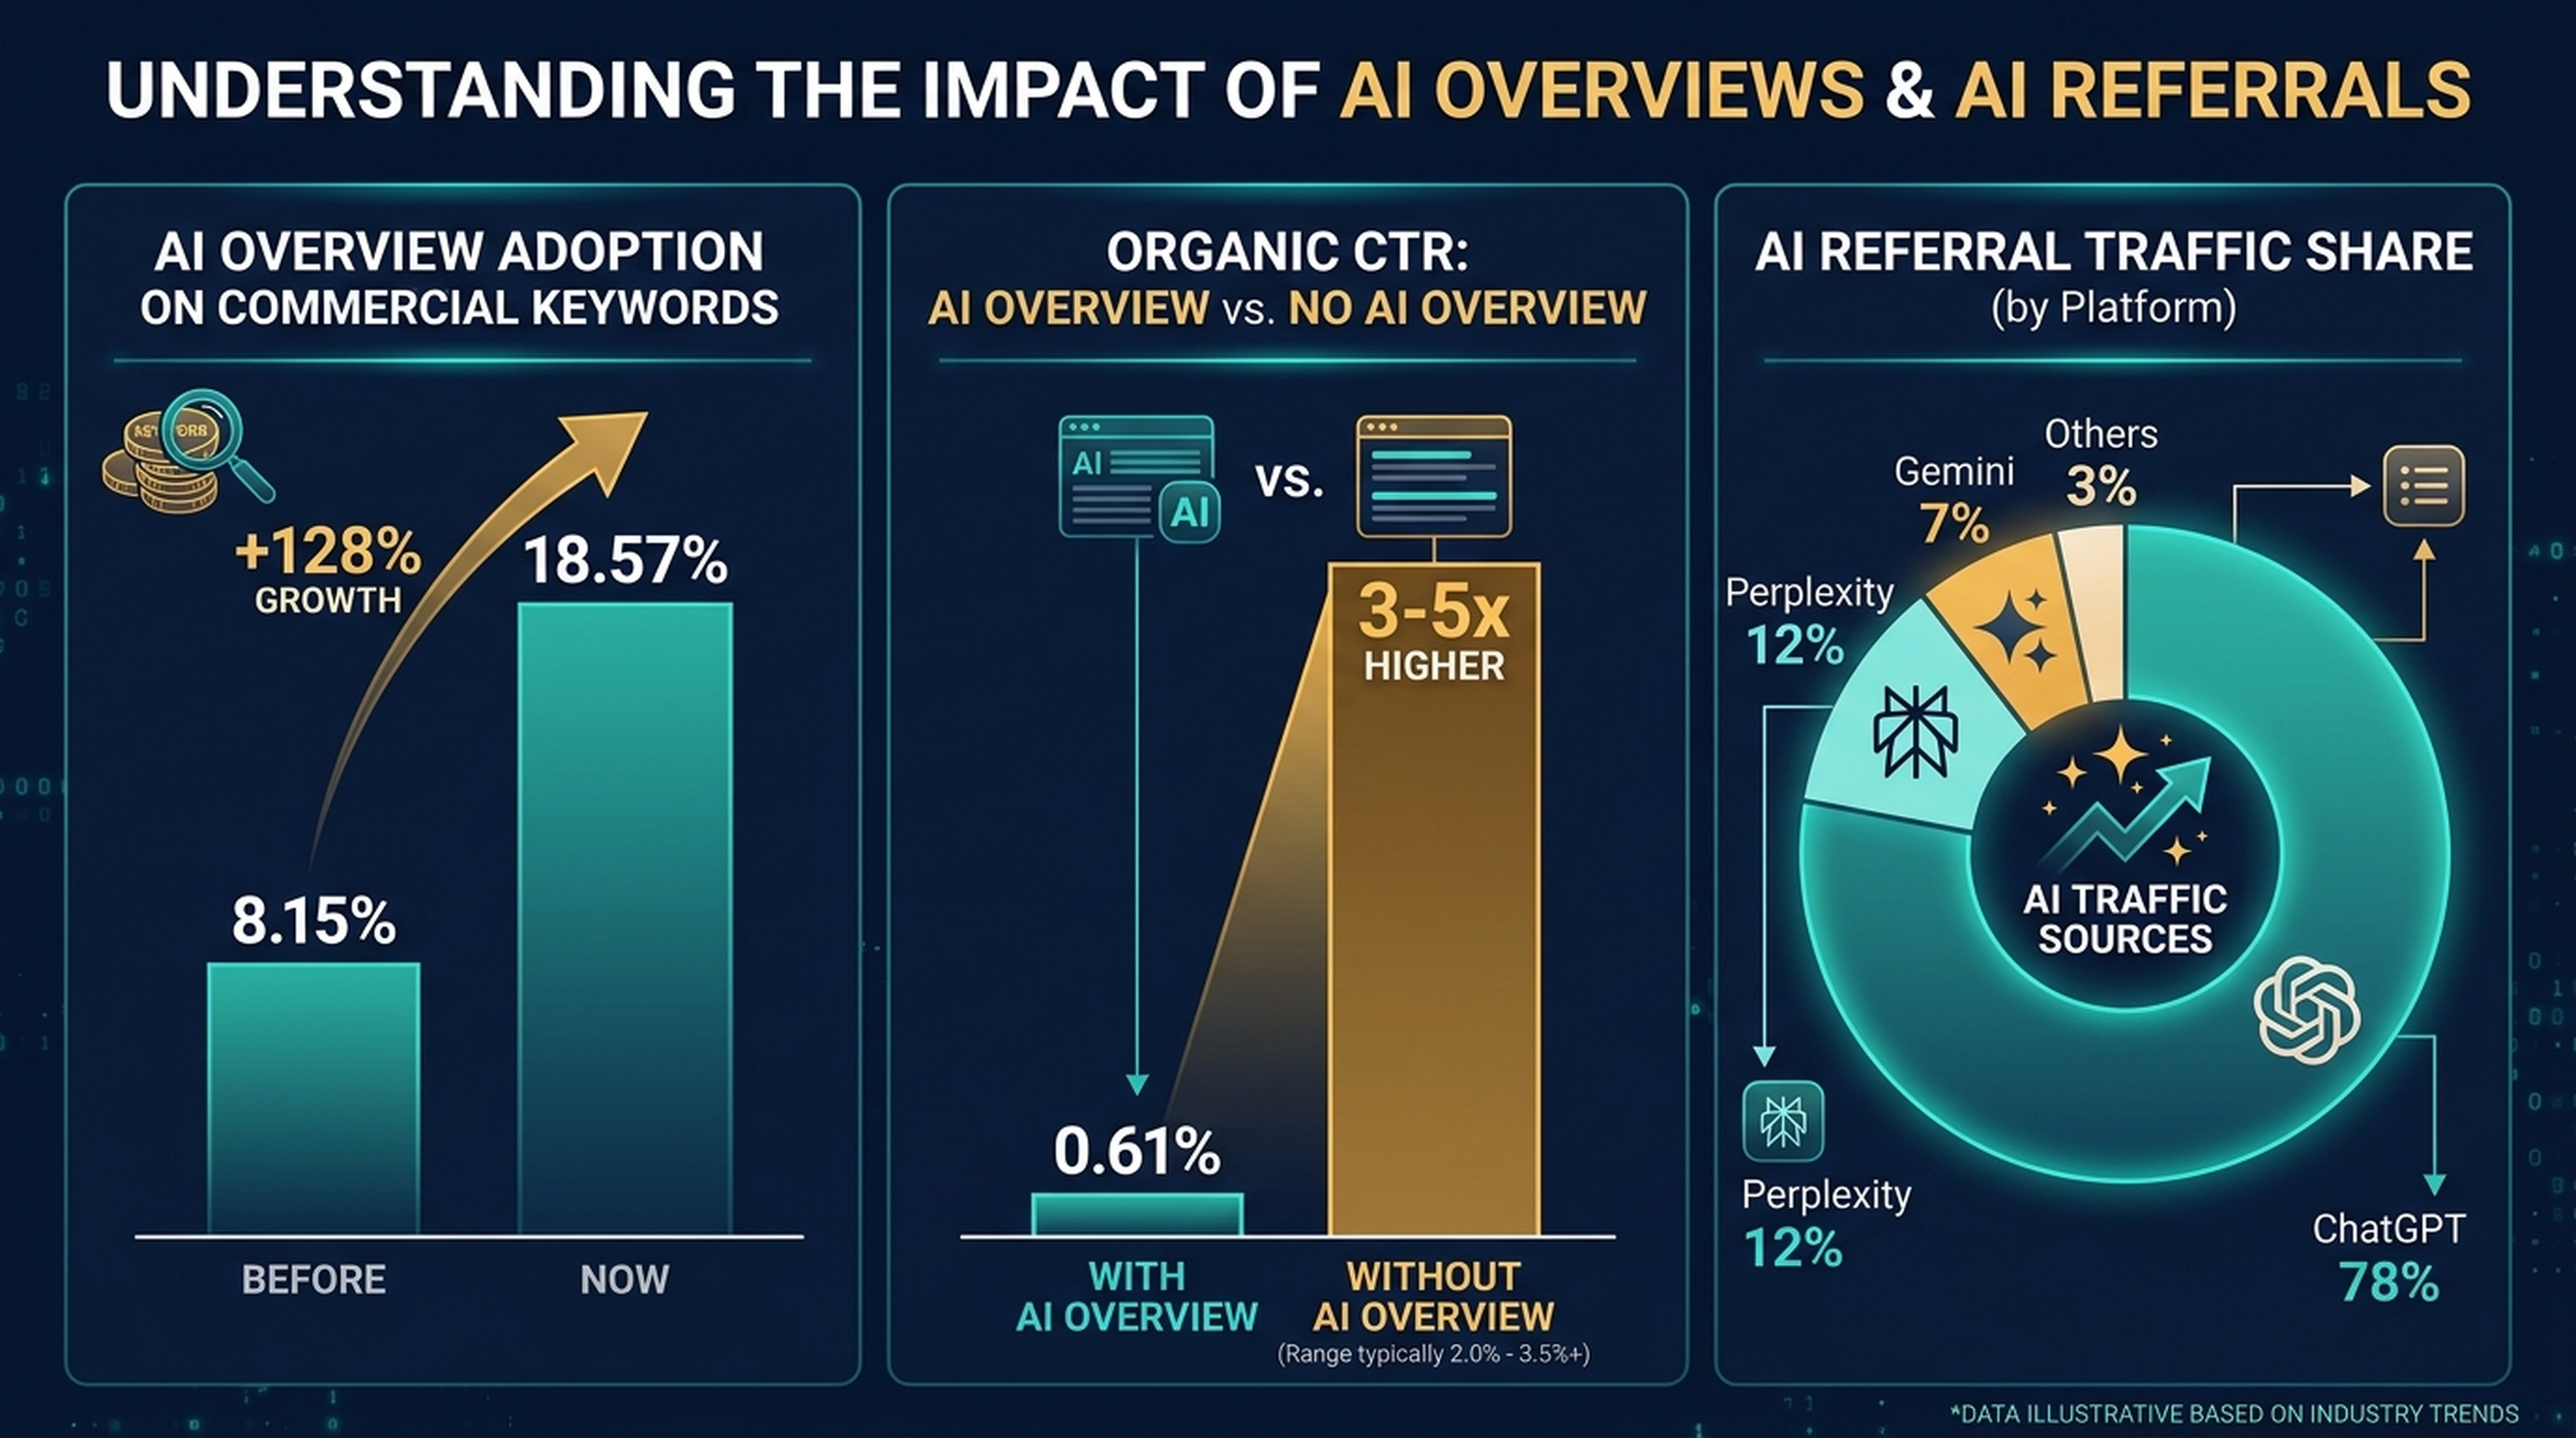
What this means: Optimizing for AI visibility (GEO) is a long-term investment, not a replacement for SEO. The immediate priority is protecting your organic CTR on non-AIO queries while building brand presence in AI answers for visibility — not clicks — today.
Ranking, Content & Backlink Statistics That Still Matter
Some SEO fundamentals have not changed. These 12 statistics separate what is still true from what is outdated:
Ranking reality:
- 96.55% of all pages get zero organic traffic from Google (Ahrefs). The content graveyard is real.
- Only 1.94% of pages get 1–10 monthly visits. The bar to "getting any traffic" is higher than most teams think.
- The average top-10 page also ranks for roughly 1,000 other keywords — topical depth beats keyword targeting.
- Google rewrites title tags 33–76% of the time and meta descriptions 62.8% of the time. Write for humans first.
Content & keywords:
- 94.74% of keywords get 10 or fewer monthly searches. Long-tail dominates search volume.
- First-page results average 1,447–1,890 words. Long-form content (2,000+ words) earns roughly 77% more backlinks than shorter content.
- 74% of new web content is AI-generated (2026 estimate). Original data and first-party research are the new differentiators.
- 15% of all Google searches have never been searched before — every day brings queries with no existing optimized page.
Backlinks:
- 95% of web pages have zero backlinks. Most content is invisible to Google's link graph.
- The #1 ranking result averages 3.8× more backlinks than positions 2–10 combined.
- Pages with referring domains from multiple industries rank better than pages with backlinks concentrated in one sector.
Technical SEO pass rates:
- Only 33% of websites pass Core Web Vitals.
- 57.5% of top-ranking ecommerce pages use schema markup — pages with schema see an estimated 40% higher CTR.
- 53.1% of homepages lack image alt text. 95.2% of sites have 3XX redirect issues.
SEO ROI & Channel Economics
Is SEO still worth it? The numbers say yes — but with different math than five years ago.
Channel | Average Close Rate | Notes |
|---|---|---|
SEO | 14.6% | Highest close rate among digital channels |
Outbound | 1.7% | Cold outreach, cold calling |
PPC | ~2–5% | Varies significantly by industry |
Social media | <1% | Organic social, not paid |
SEO leads close at roughly 8.6× the rate of outbound leads. The commonly cited SEO ROI figure is 748% over 3 years (~$7.48 return per $1 invested), though this varies dramatically by industry, competition, and execution quality.
Organic vs. paid search: Organic search accounts for 53.3% of all website traffic vs. ~15% from paid search (BrightEdge). For B2B websites, organic's share rises to 64% of sessions. But on high-commercial-intent SERPs where Google shows 4 paid ads above organic results, paid can capture 40–60% of above-the-fold clicks.
The calculus for 2026: SEO ROI depends increasingly on whether your pages provide something AI Overviews cannot replace. If your organic pages are purely informational, ROI is declining. If they include tools, proprietary data, interactive elements, or transaction paths, SEO remains the highest-ROI digital channel.
Local SEO by the Numbers
- 46% of all Google searches have local intent (Google).
- 76% of local smartphone searchers visit a business within 24 hours.
- 28% of local searches result in a purchase within 24 hours.
- Google Business Profile signals account for 32% of local pack ranking weight — reviews, categories, and proximity are the top three factors.
- 60% of smartphone users have contacted a business directly from search results using "click to call."
Local SEO remains the highest-converting SEO segment because it connects digital intent to physical action.
B2B and eCommerce SEO Statistics
B2B SEO:
- 64% of B2B website sessions come from organic search.
- B2B buyers complete roughly 70% of their research before contacting sales — and most of that research starts with search.
- The average B2B purchase involves 6–10 decision-makers, each running their own searches.
eCommerce SEO:
- 57.5% of top-ranking ecommerce pages use product schema markup.
- 37% of ecommerce traffic comes from search engines — second only to direct traffic.
- Product pages with 100+ reviews see conversion rates roughly 2–3× higher than pages with fewer than 10 reviews.
- Category pages with unique introductory content (200+ words) rank for 35% more keywords than category pages without it.
- The median ecommerce site gets roughly 28,711 monthly organic clicks (Ahrefs, May 2026), but the distribution is heavily skewed toward large retailers.
Search Engine Market Share & Volume
Search Engine | Global Market Share |
|---|---|
~90.0% | |
Bing | ~3.4–5.0% |
Yandex | ~1.5–2.5% |
Yahoo | ~1.2% |
Baidu | ~1.0% |
DuckDuckGo | ~0.6% |
Google processes roughly 8.5 billion searches per day (~99,000 per second), totaling over 5 trillion annually.
What the market share data hides: Bing powers Copilot, DuckDuckGo, and Yahoo search results. Combined, Microsoft's search index influences roughly 8–10% of English-language search queries — a growing share as Copilot adoption increases. ChatGPT Search uses Bing's index. Optimizing for Bing is increasingly a backdoor into AI answer visibility.
What to Ignore in 2026
Not every commonly cited SEO statistic is still useful. Here are four numbers that look important but should not drive your strategy:
- "Average time on page." Google has stated this is not a direct ranking factor. High time on page can mean engagement — or confusion. Track conversions, not stopwatch metrics.
- "Domain Authority" (any third-party metric). DA, DR, and AS are useful for competitive benchmarking. They are not Google metrics. A DR 20 site can outrank a DR 70 site on a specific topic if it has better topical focus and on-page relevance.
- "Keyword density." There is no optimal keyword density. Write naturally. Google's algorithms use semantic understanding, not keyword counting.
- "Word count targets." Yes, first-page results average ~1,500 words. No, that does not mean adding 500 words of filler to a 1,000-word page will improve rankings. Cover the topic completely. Stop there.
Your 2026 SEO Benchmark Scorecard
Use this table to diagnose where your site stands against 2026 medians:
Metric | Your Site | 2026 Median | Verdict |
|---|---|---|---|
Monthly organic clicks | ______ | [industry median from table above] | |
Whole-site organic CTR | ______% | 1–2% | |
Core Web Vitals pass? | Yes / No | 33% of sites pass | |
Schema markup on key pages? | Yes / No | 57.5% of top ecommerce pages | |
5-feature score (product, task, assets, focus, brand) | /5 | 2 is average | |
Pages with ≥1 referring domain | ______% | 5% of all pages | |
Top-10 ranking pages (any) | ______ | 3.45% of pages reach top 10 |
How to read your scorecard:
- Below median on 4+ metrics: Your site has a structural SEO problem. Start with technical foundations (CWV, indexation, schema), then build topical focus and authority.
- At or near median on most: You are in the pack. Differentiation — through proprietary data, tools, or sharper positioning — is your path to outperformance.
- Above median on 4+ metrics: You are in the top quartile. Protect your position by refreshing aging content, monitoring AI Overview encroachment on your key queries, and investing in the 5 features that predict 2026 traffic wins.
FAQ
What percentage of web traffic comes from organic search in 2026?
Organic search drives 53.3% of all website traffic, roughly 10× more than organic social media (BrightEdge). For B2B sites, organic's share is 64% of sessions.
Is SEO still worth it with AI Overviews taking clicks?
Yes — but the value is shifting. SEO still delivers the highest close rate (14.6%) of any digital channel. The key change: purely informational pages lose value to AI Overviews, while pages with tools, proprietary data, transactions, or interactive features gain relative advantage.
How long does it take to rank in Google in 2026?
Only 5.7% of newly published pages reach the top 10 within one year. Most pages that do rank are over 3 years old. Realistic timeline: 6–18 months for competitive keywords, 3–6 months for long-tail, assuming solid authority and topical relevance.
What's a good organic CTR for my website?
1–2% whole-site CTR is normal. If you are above 3%, you are outperforming most sites. Check your industry in the table above — CTR varies from 0.80% (Pets) to 7.53% (Adult).
What percentage of pages get no traffic from Google?
96.55% of pages get zero organic traffic. Only 1.94% get 1–10 monthly visits. If you have a page with consistent traffic, it is in the top 3.45% of all pages on the web.
Do backlinks still matter in 2026?
Yes. The #1 result averages 3.8× more backlinks than positions 2–10. But 95% of pages have zero backlinks. Quality and relevance matter more than volume: backlinks from diverse industries correlate with higher rankings.
How much does SEO cost vs. PPC?
SEO has higher upfront investment and slower returns but compounds over time — the average 3-year ROI is ~748%. PPC delivers immediate traffic but stops the moment you stop paying. The smart play: use PPC to validate keywords with conversion intent, then invest in SEO for those terms.
Author: Marcus Ellery, Growth Experimenter Behind 150+ SEO Tests at Auspia. Marcus writes about SEO benchmarks, controlled experiments, and evidence-led growth strategies that separate signal from noise.