The short version
An automotive film brand came to us in August with a problem that looks small on a dashboard and costs real money at the counter: AI assistants knew the brand existed, but rarely put it first.
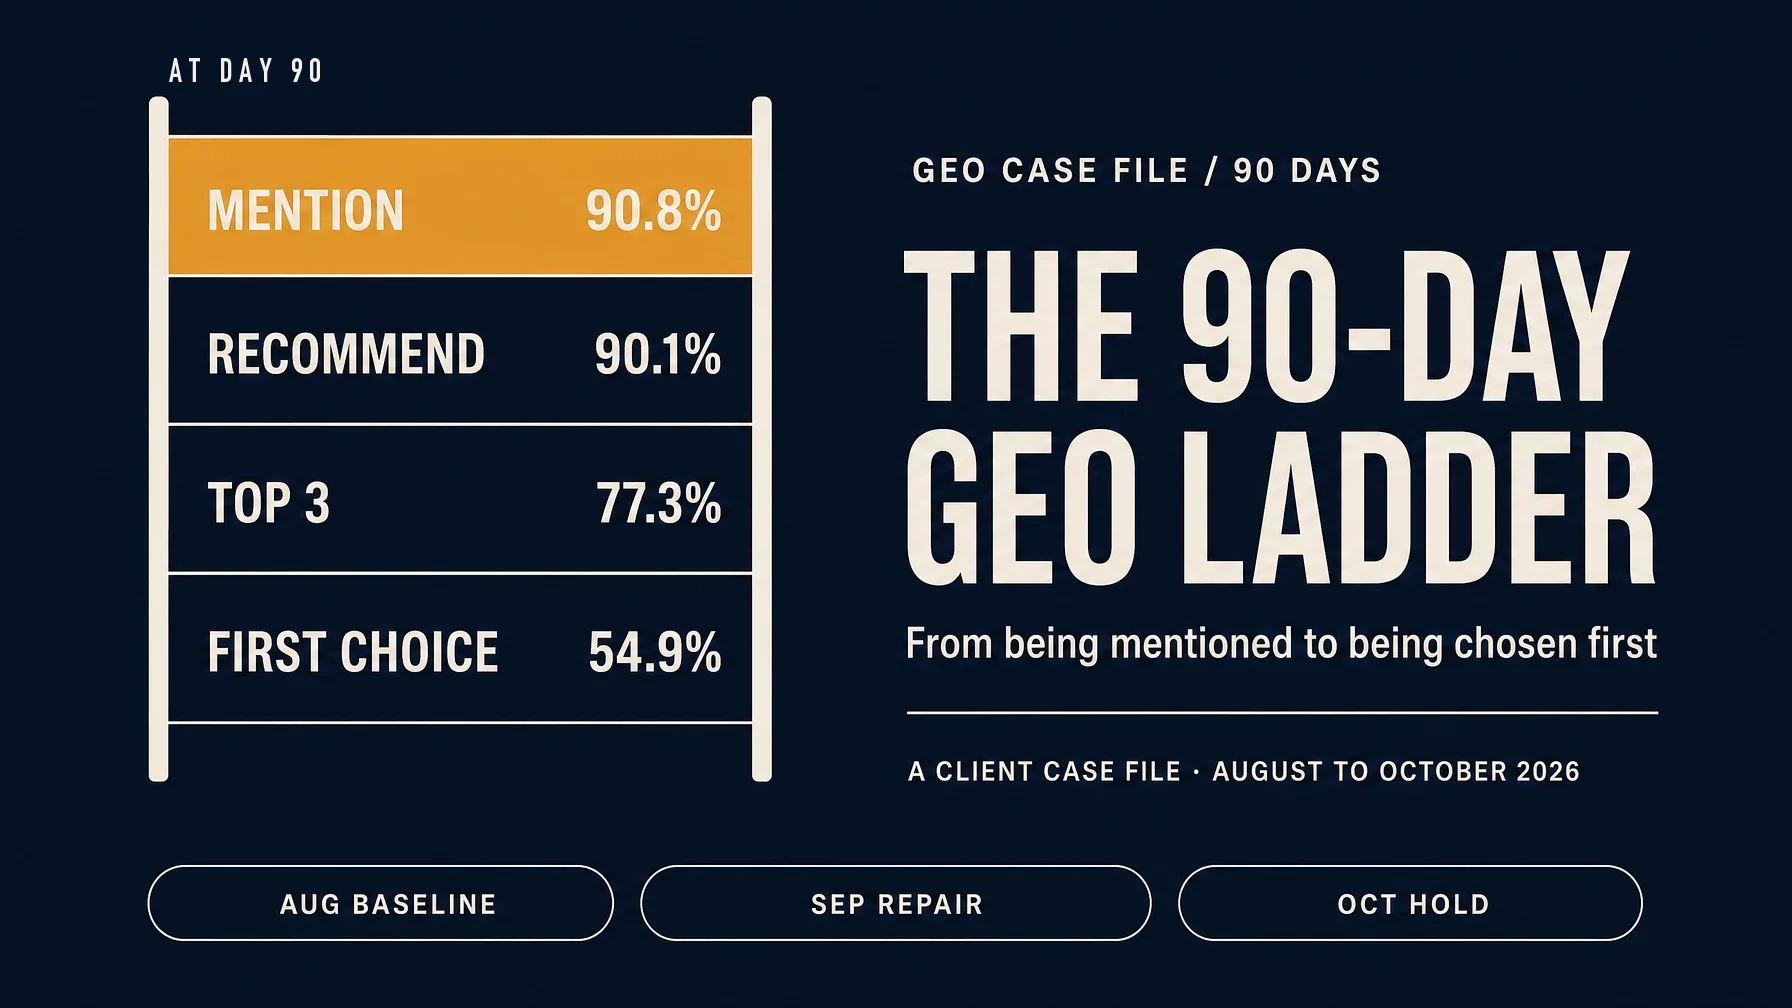
Over the next 90 days we ran a GEO program across five query categories and three answer engines. The August monthly weighted mention rate was 75.7%; the final sampling day's mention rate was 90.8%. First-choice rate finished at 54.9%; the August baseline read 5.8% under a narrower definition.
Those endpoints need a caveat, and I will give it in a moment: the team changed how it measured the top of the funnel in month two, so the early and late numbers do not measure exactly the same thing.
What holds up without a caveat:
- close to 3,000 usable answers sampled in month one, with 99.9% data completeness
- 23 sampling days in month three, 22 above the recommendation target and 23 above the first-choice target
- five query categories, three engines, tracked weekly on a fixed question set
- every content asset tied to a target question, a target engine, and a retest date
The brand asked not to be named. The figures below come from the engagement's monthly reporting packs. Where a comparison is not clean, I say so instead of dressing it up.
What "first choice" actually measures
Most GEO dashboards stop at the mention. Mention is the cheapest layer to move and the least useful thing to report to a client. It tells you the model saw you. It does not tell you whether it would send a buyer to your door.
We work with four layers, and they ask four different questions:
Layer | The question it answers | August 2026 (monthly weighted) | September 2026 (last day) | October 2026 (last day) |
|---|---|---|---|---|
Mention | Was the brand in the answer at all? | 75.7% | 81.3% | 90.8% |
Recommendation | Was it put forward as an option? | 65.8% | 81.3% | 90.1% |
Top three | Was it ranked near the top? | under 6% (limited definition) | 67.0% | 77.3% |
First choice | Was it the first option named? | 5.8% (not comparable) | 45.8% | 54.9% |
In September we moved from a single visibility definition to this four-layer model. August's first-choice figure was built under the older limit, so 5.8% is a starting story, not a measurement you can subtract from 54.9%. The clean like-for-like pair is September's last day against October's last day. When I quote growth in this piece, that is the pair I use.
Two other reading rules, because they matter for anyone copying the method:
Monthly figures are weighted across sampling days and are good for direction. Last-day figures are a single snapshot and are good for state. We read both, and we do not rank a complete month by its best single day. Sampling frequency also changed, from 11 days in August to 23 in October, which makes the later monthly figures steadier for measurement reasons as well as program reasons.
A mid-stream definition change is allowed, but it resets the baseline. It cost us a clean three-month line and bought a measurement that actually reflected what buyers see. I would make the same trade again, earlier.
Month one: better than it looked, worse than it read
August was the first full sampling cycle: 11 sampling days, just under 3,000 usable answers, 99.9% completeness. Most of the month went into something unglamorous, which was making the baseline reproducible.
The numbers themselves were a mixed picture. Mention was 75.7%, which sounds healthy until you read the next line: recommendation was 65.8%. That 9.9 percentage-point gap means roughly one in ten answers knew the brand and chose not to put it forward. Top-three coverage sat under 6% on the limited definition, and first choice was 5.8%.
The shape of the month told us more than the averages. The line climbed, peaked mid-month, then fell back by the end. That pattern shows up in almost every first baseline I have seen. Teams screenshot the peak and call it momentum. Usually it is the echo of a content push that had no refresh behind it.
The diagnosis was not a visibility problem. The brand was being described, not recommended. Its content read like a spec sheet: film thickness, UV rejection, warranty length. Useful facts, all of them, and none of them an answer to the question a buyer actually types. Someone asking whether paint protection film is worth it on a lease does not need a page about film thickness. They need a page that answers the lease question and then shows the product.
That is what month one is for. A baseline you cannot reproduce is a story, not a measurement.
Month two: fix the middle before chasing the top
September is when the four-layer definition went live, and when the first real assets shipped. Two things went out: comparison content with explicit ranking criteria, and structured local facts for the installer network. Address, opening hours, certifications, warranty terms, all in a form a model can lift without guessing.
Measured from the first sampling day of September to the last:
- mention: 72.2% to 81.3%, up 9.1 points
- recommendation: 62.6% to 81.3%, up 18.7 points
- top three: 50.9% to 67.0%, up 16.1 points
- first choice: 40.3% to 45.8%, up 5.5 points
The most useful number there is the smaller one: the mention-to-recommendation gap, which went from roughly ten points to zero by the end of the month. Every answer that mentioned the brand also recommended it. That is the middle of the funnel closing, and it is the first thing worth fixing.
Top-three conversion from recommendations reached 82.4%. Getting into the shortlist had become the easy part.
First choice was a different matter. It still swung, with a 12.4-point range across the month, a peak in week 38 and a dip after. We had repaired the middle and left the top alone. That is the normal order of operations, and in a weekly report it looks like failure. It is why the report needs a funnel view instead of a single score.
Month three: holding the top is a different job
October was the first month with a formal KPI attached: recommendation rate at or above 85%, first-choice rate at or above 30%. Five weekly periods, all above target. At day level, 22 of 23 sampling days cleared the recommendation target and all 23 cleared first choice.
The end-of-period numbers were 90.8% mention, 90.1% recommendation, 77.3% top three and 54.9% first choice. Against September's final day, that is +9.5, +8.8, +10.3 and +9.1 points.
The quieter result is the volatility. The range for first choice narrowed from 12.4 points in September to 7.0 points in October, and through the month the mention and recommendation rates ran inside an 85% to 90% band. A brand that is mentioned a lot but swings wildly is not yet trusted by the assistant. A brand inside a narrow band is starting to be.
Holding that band is maintenance work; the launch was the easy part. The work in October was less about introducing new claims and more about repeating, refreshing and re-verifying the claims that had started to work. That is a less exciting month and a more durable one.
What 100 answers looked like by the end
On the final sampling day, a representative 100 answers broke down like this: 91 mentioned the brand, 90 recommended it, 77 put it in the top three, and 55 named it first.
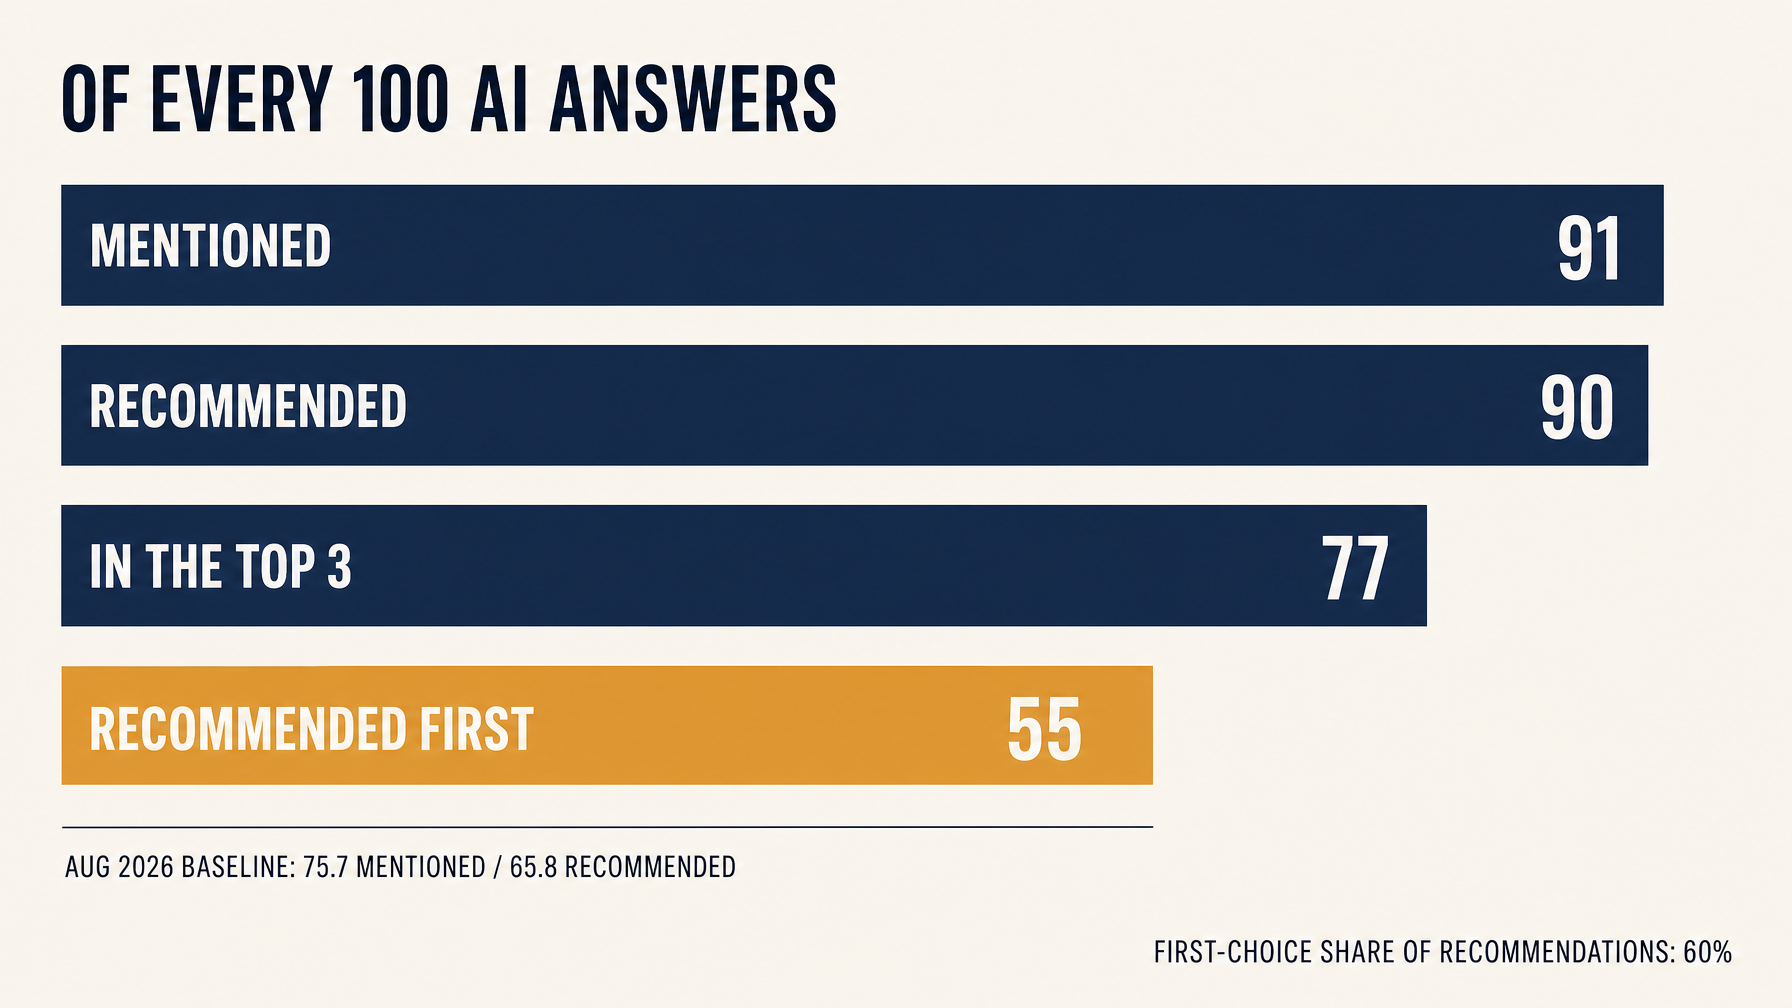
First choice ran at about 60% of recommendations. The funnel is now high and narrow: almost everyone who hears about the brand hears it as an option, and a solid majority of those hear it as the first option.
The 36 answers where the brand appeared but was not named first are the interesting ones. That is an evidence problem, not a visibility problem, and it is where the next quarter's budget should go.
Three engines stopped moving in opposite directions
The program tracked three answer engines and treated them as separate products, because they behave like separate products.
Engine archetype | What it seems to reward | August | September | October |
|---|---|---|---|---|
Volume engine (general assistant) | content density and brand coverage | led all month | peaked, then gave back 14.1 points | back in first: 93.1% recommendation, 61.4% first choice |
Technical engine (research-heavy) | structured facts, specs, quantified evidence | rose mid-month, then fell | five straight rises, 56.9% to 79.1%, passed the volume engine | 85.1% recommendation |
Lightweight engine | short conclusions and ranked lists | low throughout | middling, with weak rank quality | 86.8% coverage, ranks still behind |
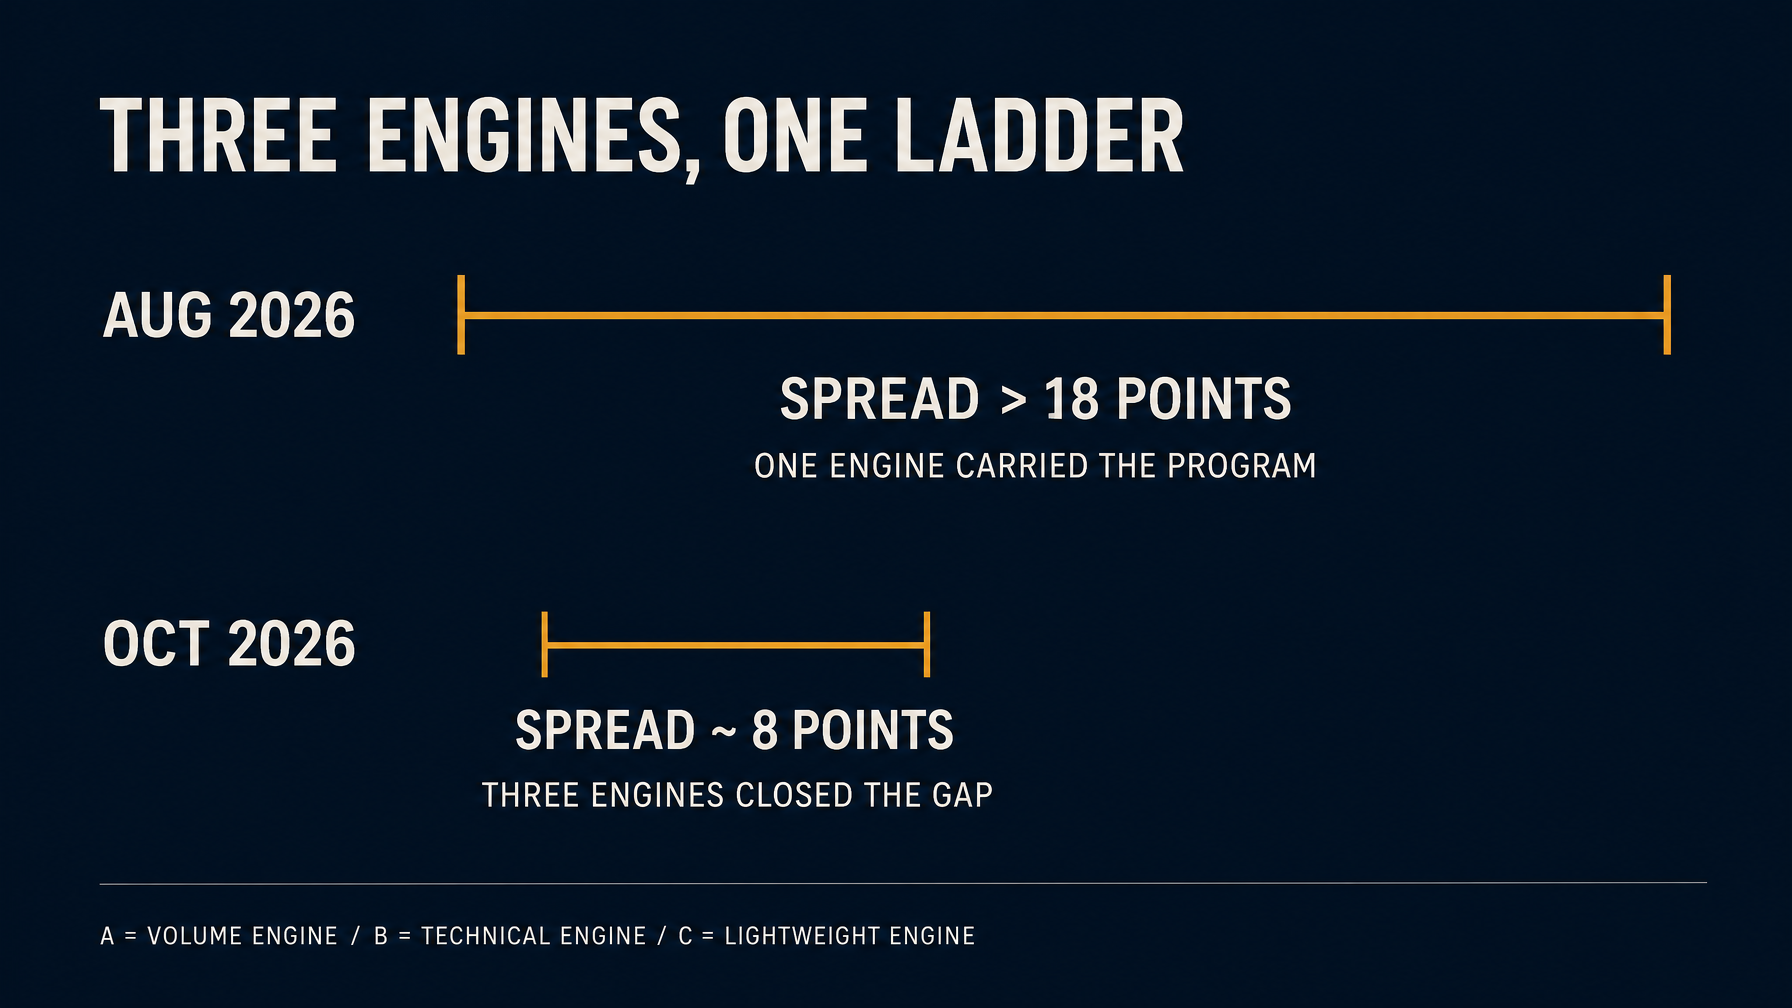
In August the spread between the three was over 18 points. By October it was about 8. The gap closed for a reason worth naming: in August the program was riding one engine. By October the lagging engines had risen toward the leader, the spread had narrowed, and the total held. That is the difference between a platform and a spike.
The lesson is uncomfortable for teams with one owner and one dashboard. Optimizing the volume engine buys reach. Optimizing the technical engine builds a factual spine. Optimizing the lightweight engine gives you the short answer a buyer repeats to a friend. None of them is the program on its own.
Five kinds of questions, one program
The five categories never moved at the same speed. Averaging them into one number hides the actual work.
Query category | What the buyer is doing | August | October | What moved it |
|---|---|---|---|---|
Brand awareness | Asking about a name they already heard | moderate | 100% recommended and 100% first from September | consistent brand facts and entity pages |
Competitor comparison | Choosing between two or three names | moderate | 100% recommended from September, first choice around 70% | side-by-side pages with explicit criteria |
Category recommendation | Asking what to buy before any brand is in mind | weakest category | 13.7% first choice, 46.3% top three | ranked lists and test evidence |
Local service | Looking for a shop nearby | under 30% recommended | 78.7% at period end, 100% first on direct store questions | structured store facts |
Long-tail (architectural film, PPF) | Asking whether the product is needed at all | strong on brand terms, thin on generic demand | PPF first choice broke zero, rank still behind | scenario explainers |
The category-recommendation column is the one to study. In September the first-choice rate was zero: the brand could get into the list and could not get near the front of it. October's 13.7% monthly average is not a triumph. It is the first real evidence that a ranked, evidence-backed list can move a brand out of the middle of the page.
The long-tail row has a dumbbell shape: strong on brand terms, weak on the generic question that comes first. That is normal, and it is where most brands misread their own progress. A 100% first-choice rate on brand questions feels good and proves little. The buyer who already knows the name was going to find you.
The competitors sorted into three tiers
Mass-market names were not the fight. In head-to-head questions against them, the brand held first choice between 70% and 90%, and that position did not need more budget. The real battleground was the leading premium competitor. A push would lift the brand for one to two weeks, then the incumbent's performance narrative would pull the answer back. That spike-and-give-back is a supply problem, not a messaging problem: the evidence that displaced the incumbent decayed before the next wave arrived.
In the specialist niches, the fight looked different again. Narrower, deeper pages from paint-protection and architectural-film specialists kept winning the long tail. The brand could win the general window-film comparison and still lose the specific question underneath it.
What we actually shipped
Three asset classes did almost all the work, and they have different jobs.
Structured facts. Store address, hours, certifications, film specifications, warranty terms. Boring to write, effective to lift. After the local facts went in, one engine's local recommendation rate for the brand moved from 32% to 60% in a single cycle. That is the most reliable asset type we have, and the least glamorous.
Ranked evidence. Third-party test references, explicit ranking criteria, and quantified differences on the dimensions a buyer cares about. This is what moves a brand from "included" to "ranked", and it is what finally moved the category and competitor-comparison categories.
Scenario solutions. Answer the generic question first and place the product second. Does glass need film? How do you choose paint protection for a leased car? Architectural film versus blinds for a west-facing room. These pages are what trigger long-tail answers where the buyer has no brand in mind.
The part nobody warns you about is shelf life. Content in AI answers decays. We watched assets lose force within one to two weeks, and a one-off drop produced the same spike-then-give-back shape that showed up whenever a push had no refresh behind it. Weekly supply is maintenance work rather than content-marketing volume. A program without it is renting its results.
The weekly loop that made it repeatable
The cadence is less exciting than the content and more responsible for the result.
Priorities were P0, P1 and P2. P0 covered a broken funnel layer, a core engine sliding, or a premium competitor taking the first answer. P1 covered new scenario coverage. P2 covered polish. Most programs fail by treating everything as P0 and spreading a small team across the whole map.
Each month had a shape: attribution in the first week, core push in weeks two and three, long-tail fill, then engine consolidation at the end. The last stage is the one teams skip. It is also the one that turns a good month into a held position.
Retesting was fixed and boring: the same question pool, weekly, same engine, same definition, with the date recorded. Without that, there is no way to tell a real gain from a new engine release.
Acceptance used two readings: the weekly merged value and the daily stability. Peaks are easy to hit and easy to lose; a month of days above target is the result.
Noise or a turn?
GEO data moves every day. The job is telling a random drift from a real change, because one leads to patience and the other leads to a rewrite.
Our rule of thumb: one week down with a next-day recovery is drift. Two periods moving the same direction, with several query categories falling together, is a turn.
Three alerts matter enough to wake someone up: the volume engine slipping on generic questions, the brand's first-choice rate against the leading premium competitor slipping for two consecutive periods, and the long-tail trigger rate declining. When one fires, the team does attribution before it touches content.
Negative answers get their own track. They are repaired point by point and rechecked, because sentiment is an early signal of whether a recommendation will survive the next engine update.
What this case cannot tell you
I would rather list the limits than have someone discover them later.
One brand, one category. Automotive film has a strong local and comparison component. A software brand or a consumer packaged good would weight these categories differently.
No holdout. We cannot separate our work from seasonality, competitor moves or engine updates. The three-month arc is consistent with the program, not proof of it.
The engines change. This is a snapshot of one quarter, not a durable index. Treat the numbers as an observation from a specific period, not a benchmark you can carry into next year.
The brand is anonymized. We can share the method and the shape of the data. We cannot share their identity, their market or their full prompt set.
These are engagement results, not a forecast. Nothing here guarantees rankings, citations or traffic for another brand, and I would be suspicious of anyone who told you otherwise after three months.
If you want to run the same 90 days
- Write the definition contract first. Four layers, fixed wording, one sampling method. It takes an afternoon and everything downstream depends on it.
- Build a fixed question pool of 40 to 60 prompts across categories. Record engine and date with every sample.
- Rank gaps by funnel layer. Fix mention before recommendation, recommendation before top three, top three before first choice. Climbing in order feels slower for two weeks and is faster for a quarter.
- Ship two or three asset classes, not ten. Tie each one to a question, an engine and a retest date.
- Hold the position with a weekly refresh and a monthly rebalance. If you cannot staff the refresh, plan for the give-back.
If you want a starting read on where your pages currently sit in AI answers before you commit to a program, a one-page GEO citation audit is enough to see the shape of the funnel. Run the one-page GEO citation audit.
FAQ
How long before GEO shows movement?
In this engagement, the middle of the funnel moved inside the first two months. First choice moved meaningfully in the third. That pace depends on how much citable evidence already exists and how often you can refresh. A brand with no comparison content and no structured facts should expect the slower end.
Is a high mention rate enough?
No. Mention is the cheapest layer, and a brand can be mentioned in most answers while being recommended in few. The gap between mention and recommendation is the first diagnostic I look at, because it tells you whether the models have a reason to put you forward.
Do we have to optimize every engine?
No, but you need to know which ones your buyers use. In this case the volume engine carried the brand early and the technical engine produced the most durable lift. A program that ignores the engine where buyers actually ask will look balanced on a dashboard and stay invisible in practice.
Can this work without a local store network?
Yes, with a different weighting. Local structured facts mattered a lot here because the brand sells through installers. A brand without local intent should put more of its effort into comparison evidence and category pages, which did the heavy lifting for the non-local categories.
Why did first choice jump in month three and not month two?
Because the funnel repairs in order. Month two closed the mention-to-recommendation gap and lifted top-three conversion. First choice needs something else: consistent evidence across several engines, repeated often enough that the model prefers it. That work compounds later than visibility work, and it is less visible in weekly numbers.
What would you do differently?
Two things. I would write the definition contract before the first sample rather than in month two, and I would start third-party evidence earlier. Both would have shortened the clean measurement line and moved the category work forward by a few weeks.
Author: Vivian Brooks, B2B Case Study Strategist at Auspia. Vivian writes about case-style evidence, outcome framing, and what campaign numbers actually prove.