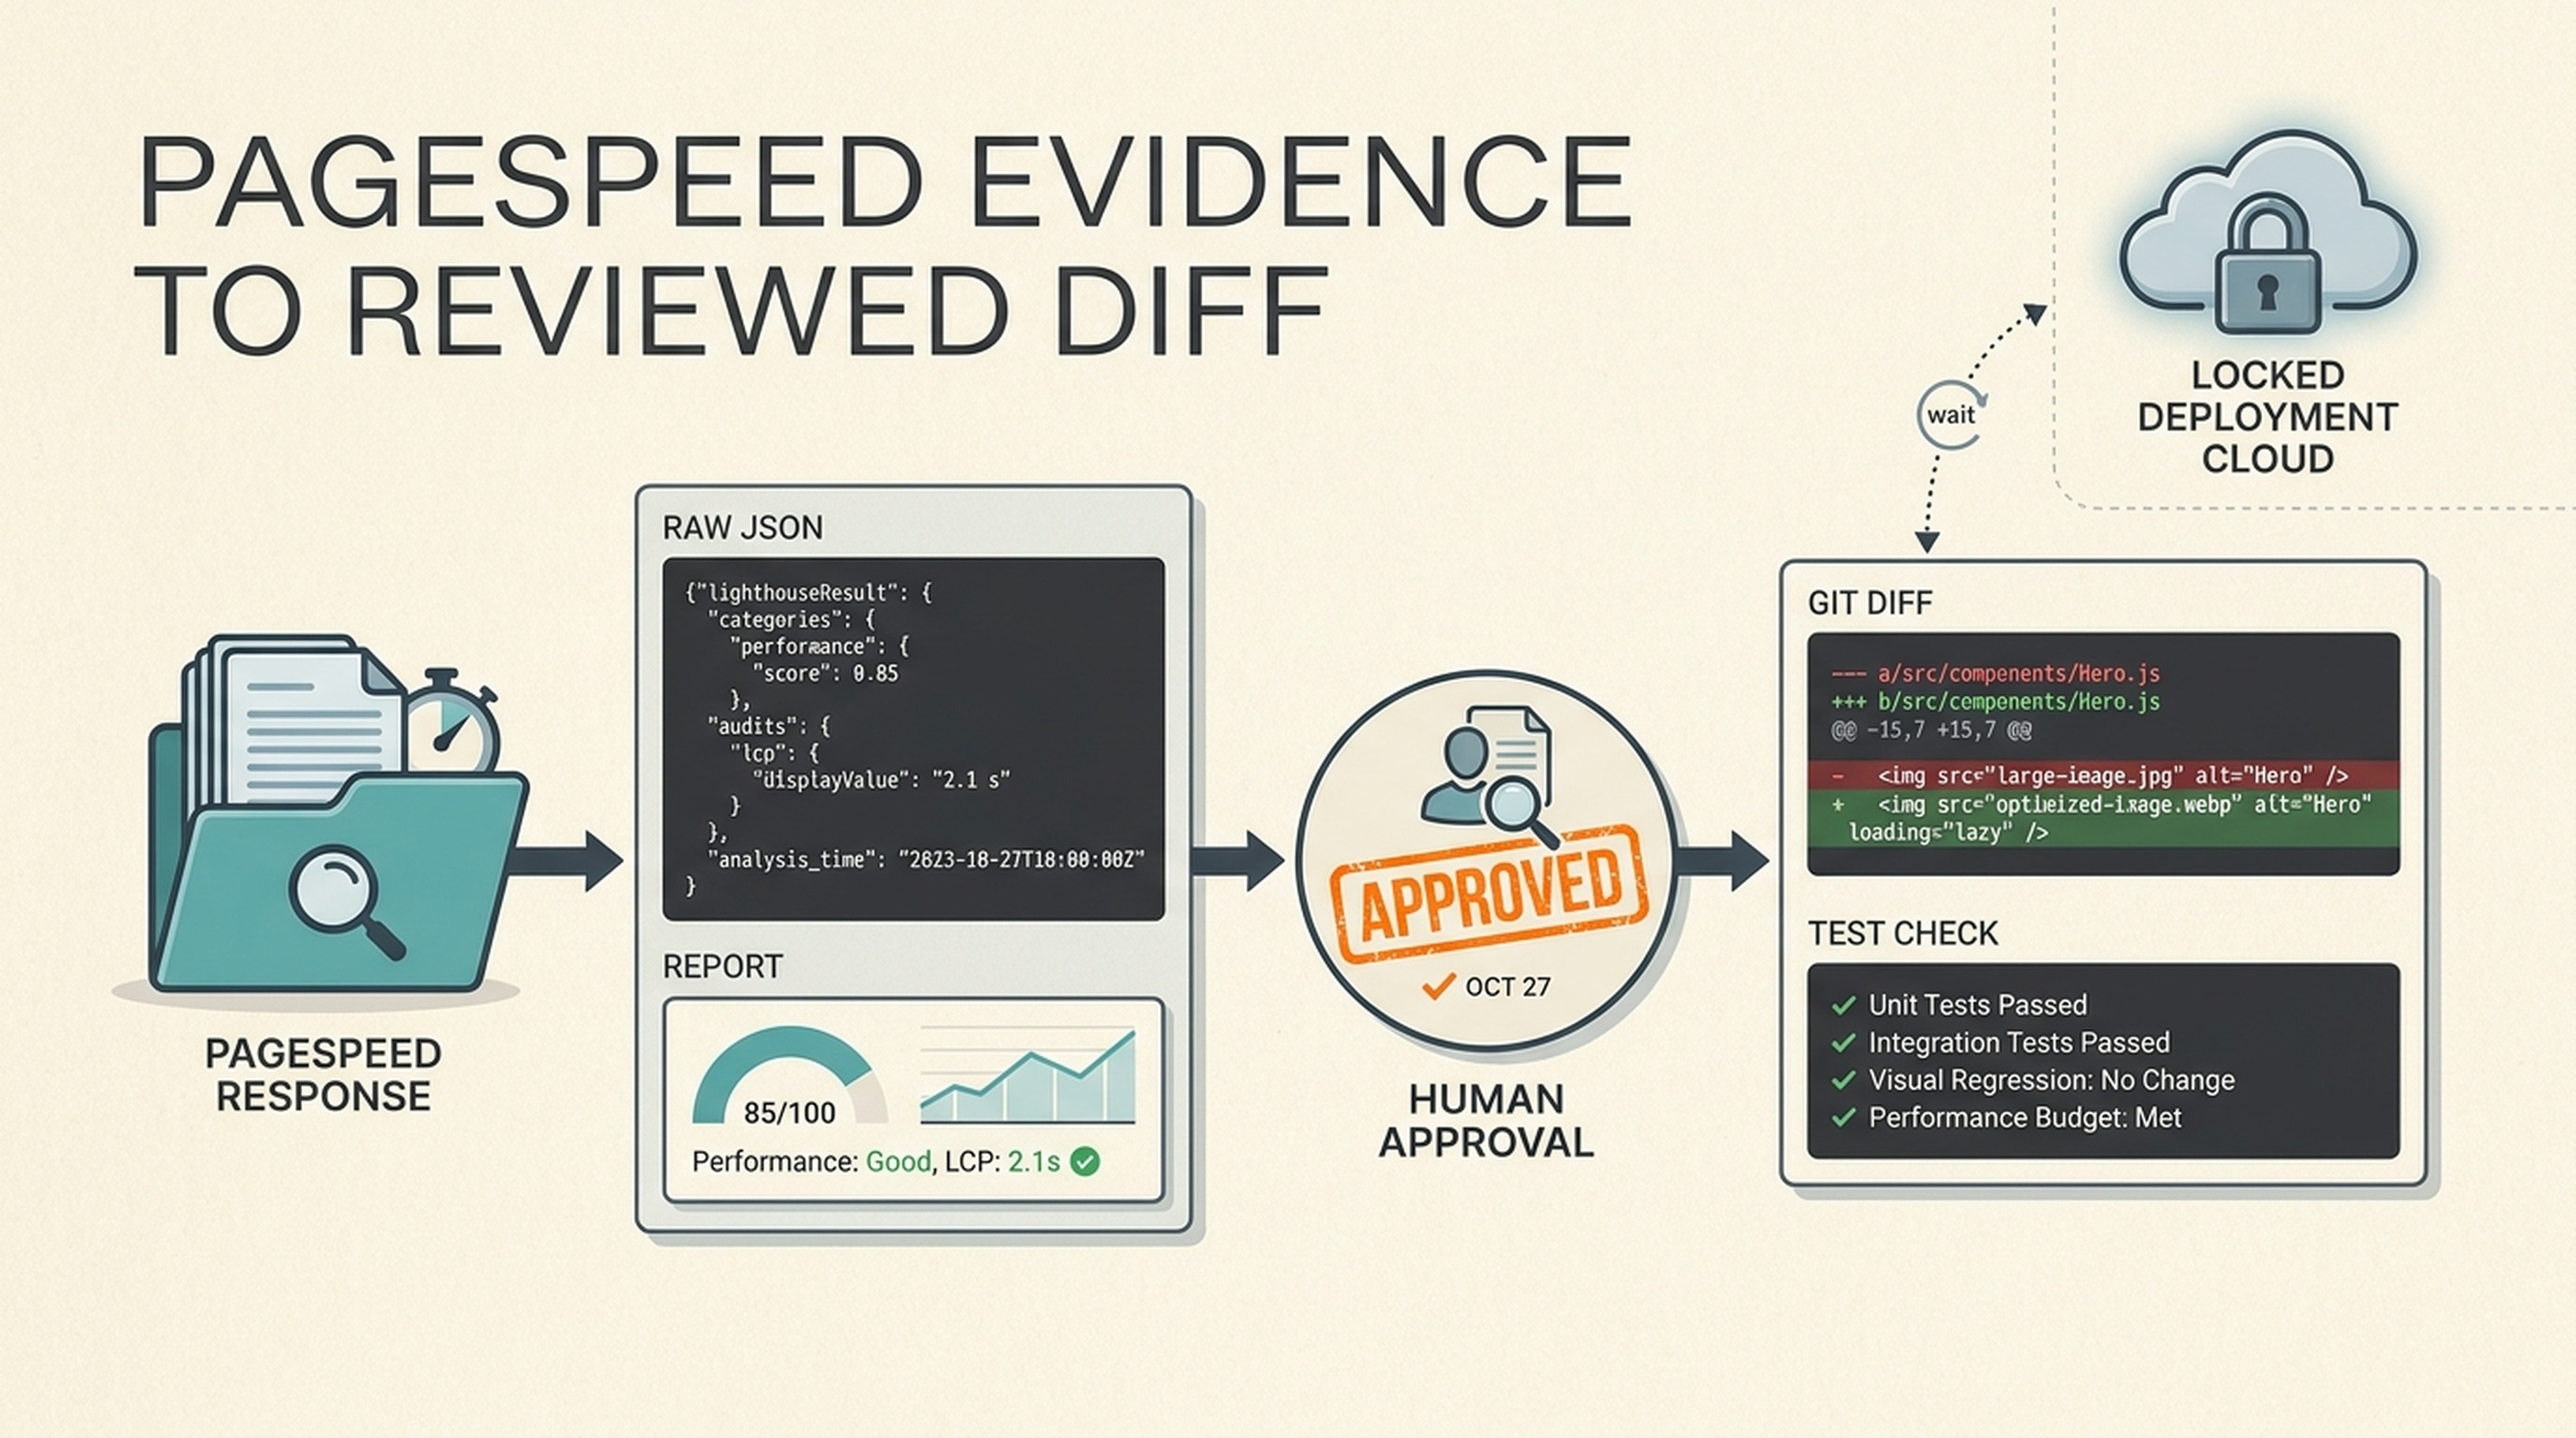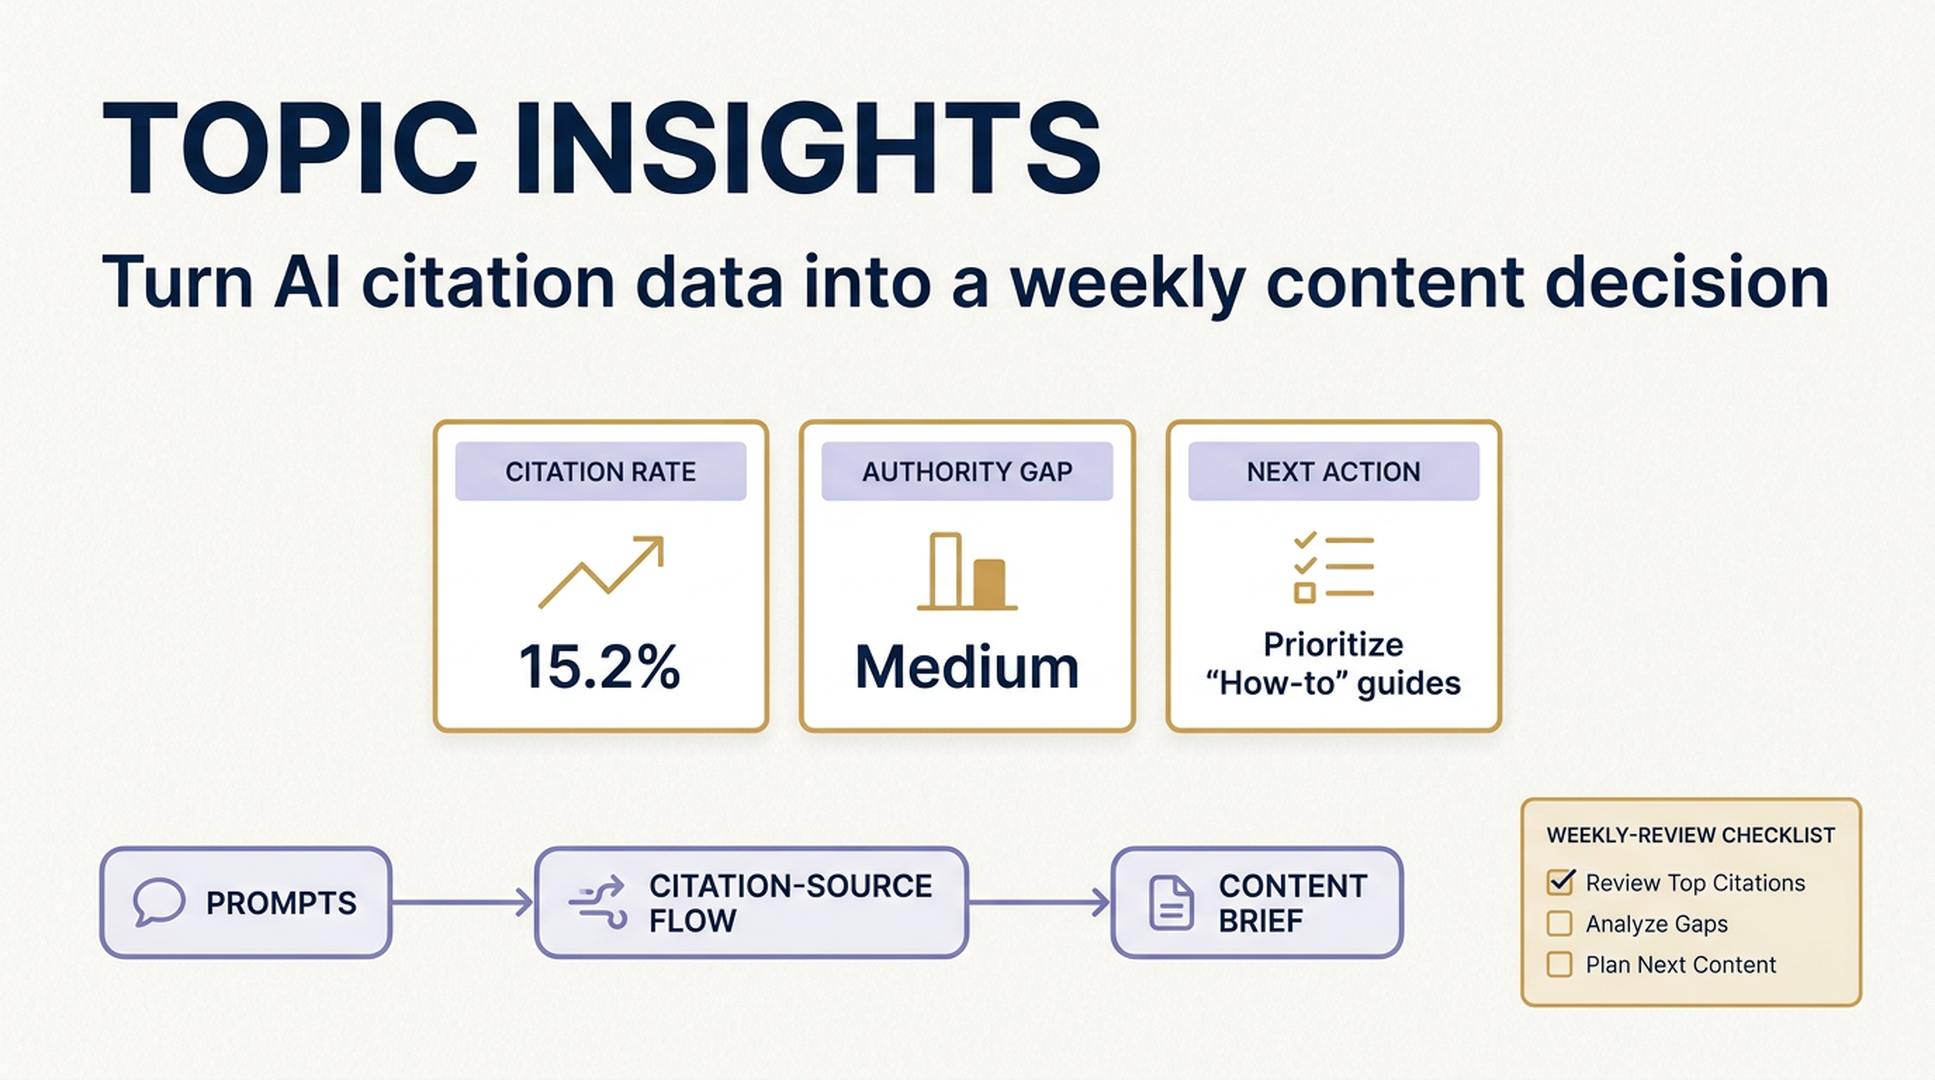
The useful way to read Topic Insights
Microsoft Clarity's Topic Insights is useful when you already have AI Visibility data but cannot tell what to do with a collection of citations. It groups the view around a topic and puts four questions on the same dashboard:
- How often does your site appear in the tracked prompts?
- How much of the cited material belongs to you versus other sites?
- How much of an AI answer does your content contribute when it appears?
- Which domains are taking the authority in the topic?
That makes it a planning view, not a promise of rankings. A high citation rate does not mean every important query is covered. A low competitive share does not prove a technical problem. Use the dashboard to choose what to investigate next, then validate the pages, prompts, and source material behind the number.
What this guide covers: how to open Topic Insights, interpret the visible metrics in the dashboard, turn a competitor gap into an editorial brief, and set up a simple weekly review.
Microsoft positions AI Visibility as a reporting surface for AI-related activity and data connections. Its documentation also notes that, after edge logs begin streaming again, processing can take a few hours before metrics update. Keep that delay in mind before reacting to a sudden change in the charts. Microsoft's troubleshooting guide is the right place to start if the data itself appears to have stopped.
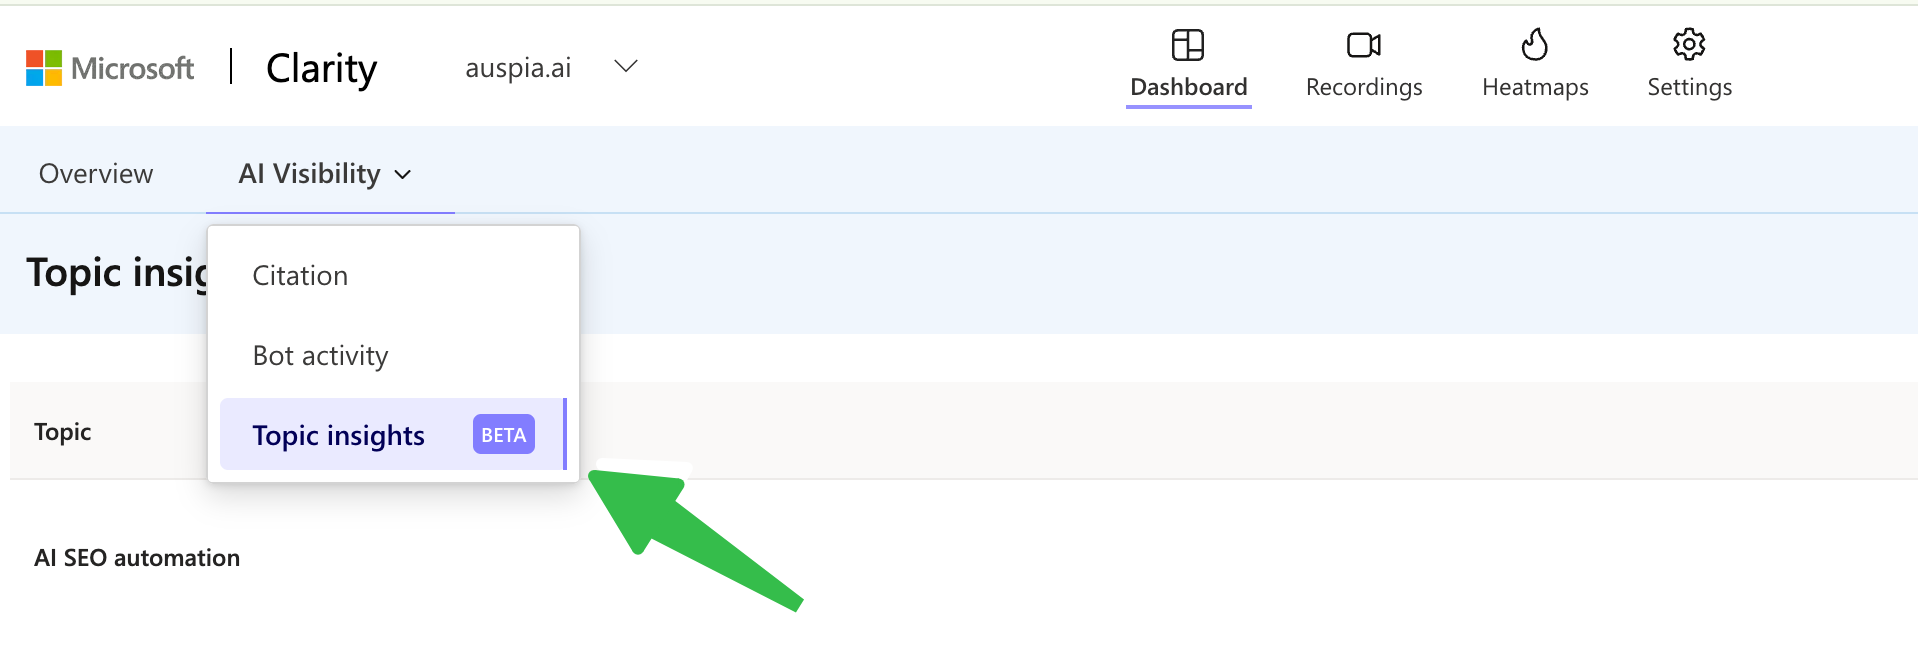
Figure 1. Open the AI Visibility menu in Clarity and select Topic insights (Beta).
Before you start: choose one topic with a real decision behind it
Do not begin with a topic that is too broad, such as "SEO" or "AI." A Topic Insights review works best when your team can name a real decision it needs to make: which supporting page to publish, which existing guide to improve, or which competitor source pattern to study.
For example, the dashboard in this guide is scoped to AI SEO automation. That is narrow enough to examine competing domains and content gaps, but broad enough to contain several prompt and page opportunities.
Write down these three items before opening the report:
| Input | Example | Why it matters |
|---|---|---|
| Topic | AI SEO automation | Keeps the analysis focused on one content market. |
| Business question | Which pages would improve our chance of being cited for automation workflows? | Stops the dashboard review from becoming passive reporting. |
| Review window | This week versus the prior review | Makes changes easier to interpret. |
If your list of prompts mixes buyer questions, definitions, and product comparisons, split them before drawing conclusions. Those intents often produce different source sets and different answer formats.
Step 1: Open Topic Insights
- In Microsoft Clarity, choose the relevant project.
- Open AI Visibility in the dashboard navigation.
- Select Topic insights. The entry is marked Beta in the product navigation shown above.
- Select the topic you want to review.
- Check the date in the top-right of the report before comparing it with a prior review. The dashboard view also shows the next scheduled run.
Use the report's overflow menu only after you have recorded the topic and reporting date. Exporting a number without that context creates confusion when the next run changes the denominator or the citation mix.
Step 2: Read the three headline metrics as a set
The upper cards in the example report show Competitive share, Citation rate, and Avg. answer contribution. Read them together; isolating one of them is where most poor decisions start.
| Metric shown in the dashboard | Plain-English question | A practical response |
|---|---|---|
| Competitive share | What share of all page citations belongs to our site? | If it is small, identify the domains and source formats taking the share before creating new content. |
| Citation rate | Across the prompts in this topic, how often was our site cited? | If it is low, examine the prompt groups where you are absent and the pages those answers cite. |
| Avg. answer contribution | When our content appears, how much of the response does it supply? | If it is low, make the cited page more complete for the specific question rather than merely adding keywords. |
In the supplied example, the cards show 30% competitive share, a 45% citation rate, and 34% average answer contribution. Those numbers are a starting point for diagnosis, not targets to copy. A niche topic may need a different threshold from a broad category with many established publishers.
A quick interpretation rule:
- Low citation rate + low answer contribution: begin with coverage. You may not have a page that answers the question cleanly.
- Good citation rate + low answer contribution: strengthen the page's depth, evidence, examples, and direct answer blocks.
- Low competitive share + healthy citation rate: look at the concentration of citations. A few competitors may own the key source pages while you appear across less valuable prompts.
- High values across all three: protect what works, then test adjacent questions rather than rewriting the winning page without a reason.
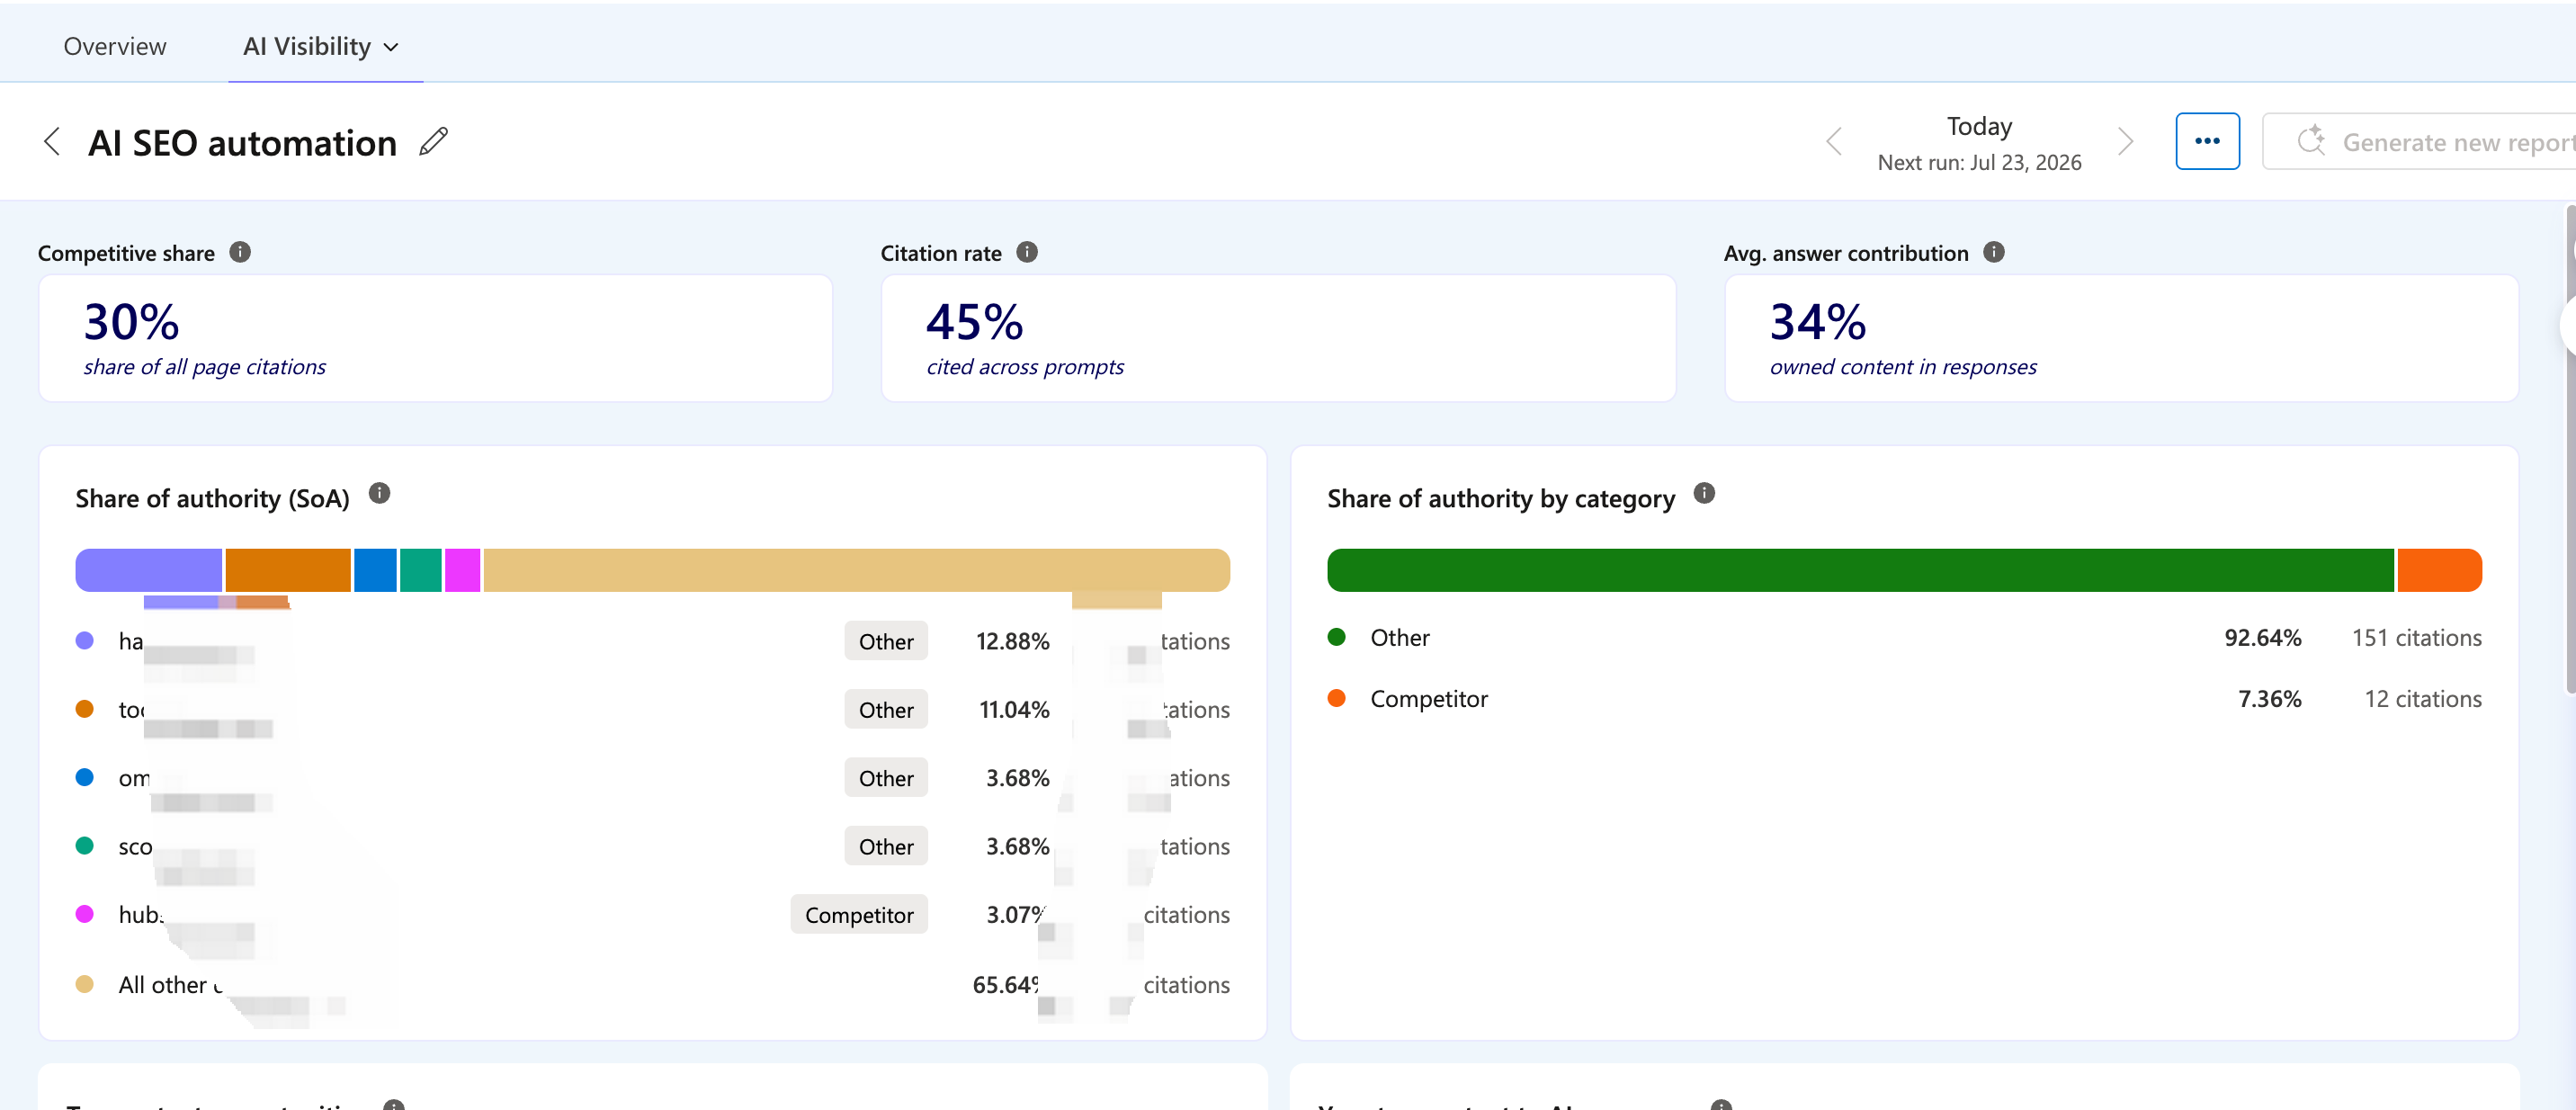
Figure 2. The topic dashboard combines headline citation metrics with domain and category authority views.
Step 3: Find the authority gap, not just the biggest competitor
The Share of authority (SoA) panel shows a distribution of page citations by domain. The dashboard also labels domains by category, such as Other or Competitor. This is the part of the report that turns an abstract visibility score into a research list.
Use this four-column worksheet while you review the panel:
| What you see | What to inspect next | Decision to make | Avoid doing this |
|---|---|---|---|
| One domain holds a large share | The cited URLs, page types, and questions it answers | Decide whether there is a meaningful content gap or only a brand-authority gap | Copying its heading structure or publishing a near-duplicate |
| Many "Other" domains share the space | Repeated formats across sources: guides, docs, lists, tools, comparisons | Build the missing page format, supported by your own evidence | Assuming one named competitor explains the whole topic |
| Your domain is cited but contributes little | The exact section or claim most likely used | Expand the answer around the user's task and add sourceable proof | Adding generic filler to make the page longer |
| A competitor is classified in the report | Its recurring topic coverage and source assets | Decide whether it belongs in the monitored competitive set | Treating the label as a verdict on business competition |
The Share of authority by category chart is a useful sanity check. If most citations are categorized as "Other," the market may be more fragmented than a single competitor comparison suggests. That usually calls for source-pattern research: what formats are winning, what questions do they answer, and what evidence is consistently present?
Step 4: Turn one dashboard finding into a content brief
Here is a safe way to move from observation to action.
Imagine that your topic has a reasonable citation rate, but average answer contribution is low. Do not jump straight to a new article. First select one cited page of yours and one competitor page that appears repeatedly. Compare the two on the question the prompt is actually asking.
Build a brief with the following fields:
| Brief field | What to write |
|---|---|
| Query or prompt group | The exact task or question, such as "how to automate an AI visibility report." |
| Current cited asset | Your existing page and the section most relevant to the task. |
| Missing answer component | A setup step, a worked example, a comparison, a limitation, documentation, or evidence. |
| Planned improvement | A specific new section or a separate page with a distinct search intent. |
| Verification method | Recheck the same prompt group after the next report run and review the source mix, not just one percentage. |
For an automation topic, that could mean adding a step-by-step report setup example, a clear explanation of where the data comes from, and a troubleshooting section for missing data. It does not mean claiming that a content update will cause an immediate citation increase.
For a quick pre-publication check, run the draft through Auspia's AI Search Visibility Checker . Use it as a content and visibility review input, then keep Clarity as the measurement surface for the monitored topic.
Step 5: Put Topic Insights on a weekly operating rhythm
Topic Insights becomes more useful when the same person reviews it on a fixed cadence. A lightweight 20-minute review is enough for most teams.
| Time | Activity | Output |
|---|---|---|
| 0-5 minutes | Confirm the topic, reporting date, and whether data looks complete | A trustworthy review context |
| 5-10 minutes | Compare the three headline cards with the prior run | One sentence explaining the change, without guessing the cause |
| 10-15 minutes | Inspect the largest authority sources and category split | A short list of pages or source formats to study |
| 15-20 minutes | Choose one content, technical, or prompt-library action | An owner, due date, and recheck condition |
Keep a small change log alongside the report. Note when you published or substantially updated a page, altered internal links, changed a tracked prompt, or encountered a data connection issue. Without this record, dashboard movement tends to invite stories that the data cannot support.
When the dashboard suddenly looks empty or incomplete
An empty or sharply reduced view can be a measurement issue rather than a visibility collapse. Microsoft's AI Visibility troubleshooting guidance says that a CDN traffic-drop alert can indicate a sudden decrease or stop in edge-log data flowing into the dashboard. It recommends checking the relevant AI Visibility connection and token permissions, then allowing time for the pipeline to process resumed logs.
Use this sequence before changing your content plan:
- Check whether your normal site traffic also fell sharply. If it did, investigate hosting, DNS, or a wider traffic issue first.
- Review Settings > AI Visibility and confirm that the relevant connected service or credentials still have the required access.
- Recheck the report after logs resume. Microsoft notes that metrics can take up to a few hours to return to the AI Bot Activity dashboard.
- Only then compare the topic metrics again and decide whether the change reflects user-facing visibility.
The exact connection checks vary by your Clarity setup, so follow the applicable section in Microsoft's troubleshooting documentation rather than using a generic fix.
A short checklist for your first review
- [ ] I selected a narrow topic with a content or market decision behind it.
- [ ] I recorded the report date and next run before comparing percentages.
- [ ] I read competitive share, citation rate, and answer contribution together.
- [ ] I inspected the authority distribution and category split before choosing a competitor.
- [ ] I turned one finding into a page-level brief with a verification method.
- [ ] I checked for a data connection issue before reacting to a sudden decline.
- [ ] I assigned one action for the next reporting cycle.
FAQ
What is Microsoft Clarity Topic Insights?
Topic Insights is a Beta view inside Clarity's AI Visibility area that presents topic-level citation, authority, and competitive-share signals. In the supplied product view, it includes headline cards for competitive share, citation rate, and average answer contribution, plus authority charts by domain and category.
Does a higher citation rate guarantee more traffic or rankings?
No. The metric describes the tracked prompt set and report period. It can help you prioritize investigation, but it does not isolate the effect of one page change or guarantee a traffic outcome.
What should I do if "Other" owns most of the authority chart?
Treat it as a source-pattern problem. Study the cited page types and the questions they answer. A fragmented group of sources may reveal a missing format or evidence type more clearly than one direct competitor does.
How long should I wait after an AI Visibility connection issue?
Microsoft says that, once logs are streaming again, its processing pipeline can take up to a few hours to resume updates in the AI Bot Activity dashboard. Confirm that the data has returned before interpreting a topic-level decline.
Where can I find the Topic Insights feature?
Open the Clarity dashboard, select AI Visibility, and choose Topic insights from the menu, as shown in Figure 1. Availability and labels can change while the feature is in Beta.
Sources
- Auspia announcement: "Clarity's new Topic Insights" , July 16, 2026.
- Microsoft Learn: Troubleshooting AI Visibility , accessed July 16, 2026.
Author: Ethan Marlowe, GEO Measurement Lead Across 500+ Prompts at Auspia. Ethan writes about prompt tracking, citation reporting, and visibility dashboards for growth teams.