

The short version
A page can be cited by ChatGPT, Google AI Overviews, or Perplexity and still contribute almost nothing to the answer a user reads.
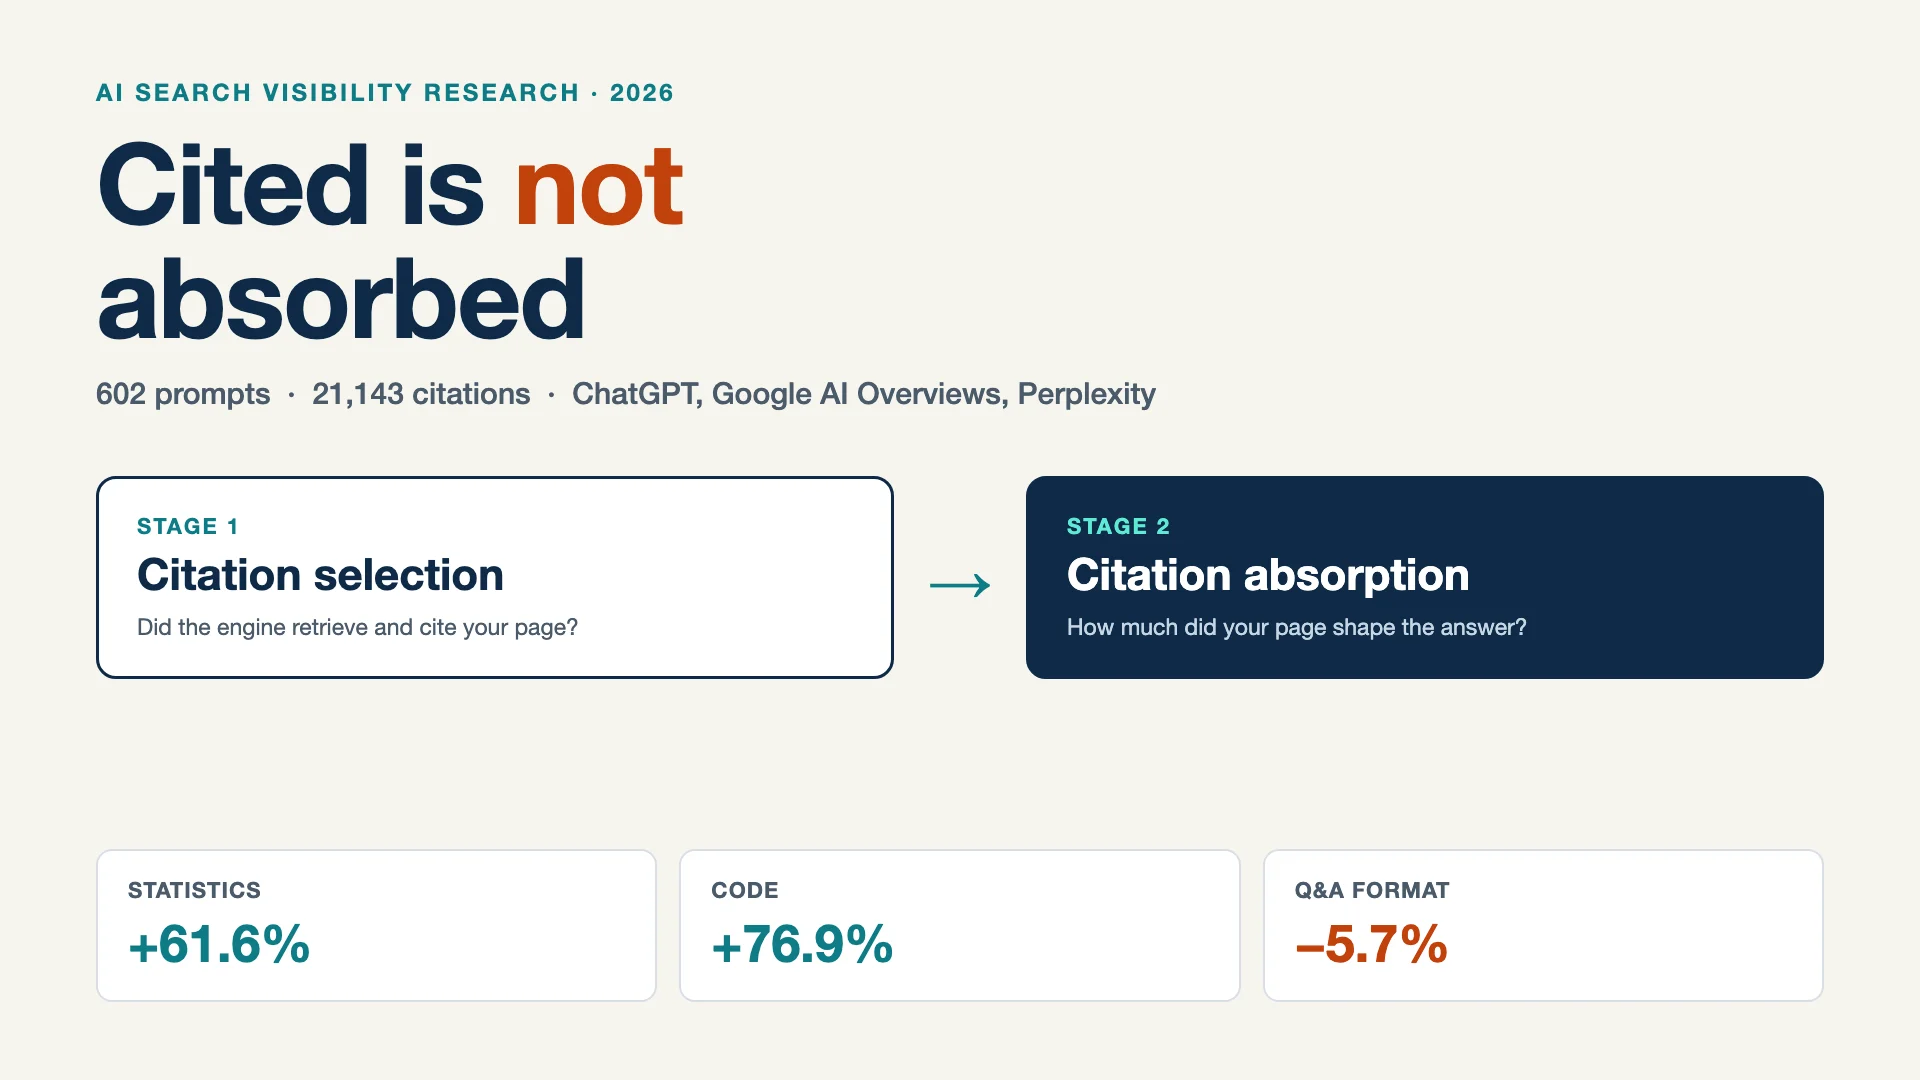
That is the central finding of a 2026 study that analyzed 602 controlled prompts, 21,143 valid citations, 23,745 citation-level feature records, and 18,151 successfully fetched pages across the three platforms. The paper is From Citation Selection to Citation Absorption, published on arXiv by Zhang Kai, He Xinyue, and Yao Jingang, and it draws on the public geo-citation-lab dataset.
The authors split AI visibility into two stages. Citation selection is whether a platform retrieves and cites your page. Citation absorption is how much your page actually shapes the generated answer. Their headline result: the two do not move together.
Perplexity cited the most sources per prompt at 16.35 on average. ChatGPT cited the fewest at 6.88. But among pages that were successfully fetched, ChatGPT citations scored a mean influence of 0.2713, compared with 0.0584 for Google and 0.0646 for Perplexity.
More citations did not mean more influence. Fewer, deeper citations did.
If your GEO dashboard only counts citations, it is measuring the door. The room is somewhere else.
What the study actually measured
Before the tactics, it is worth being precise about what "influence" means here, because the number is easy to overread.
The researchers built an influence_score between 0 and 1 for each cited page. It is a weighted composite of five observable signals:
- How often the page is referenced in the answer (20%)
- How early it appears (15%)
- How much of the answer's paragraphs it covers (20%)
- TF-IDF cosine similarity between the page and the answer (25%)
- Average bigram and trigram overlap (20%)
This is a proxy, not a window into the model. The paper says so directly: the score is "a constructed observational proxy rather than a direct measure of hidden model attention, retrieval ranking, or causal dependence." A page can score high because its language closely resembles the answer, not necessarily because the model leaned on it in any deep sense.
That caveat matters. It means you should treat the directional findings as strong hypotheses, not as a formula to game. The authors themselves separate what the data can support (descriptive patterns) from what it cannot (causal claims that adding a feature will raise your citations).
With that framing in place, the patterns are still worth your attention.
The numbers that should change your content plan
Statistics and code correlate with far higher influence
The study compared mean influence for pages with and without specific evidence types.
Page contains | Mean influence (yes) | Mean influence (no) | Relative difference |
|---|---|---|---|
Code | 0.1747 | 0.0988 | +76.9% |
Numbers / statistics | 0.1171 | 0.0725 | +61.6% |
Definition markers | 0.1252 | 0.0795 | +57.3% |
Comparison content | 0.1389 | 0.0894 | +55.3% |
How-to content | 0.1296 | 0.0918 | +41.2% |
Q&A format | 0.0947 | 0.1005 | -5.7% |
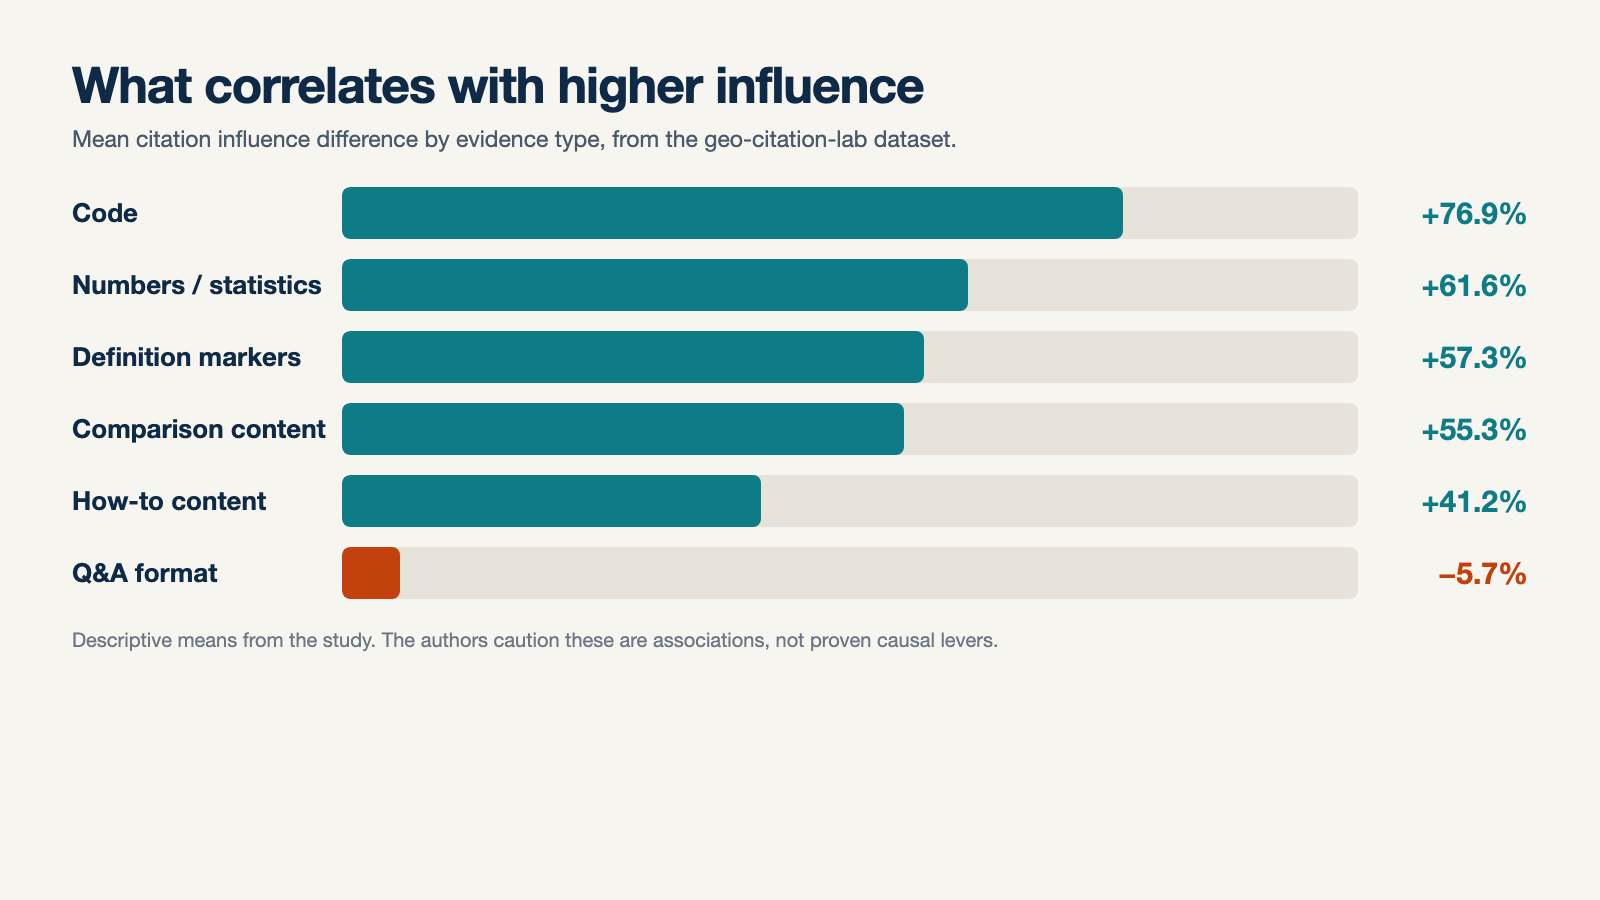
Evidence genres and their association with citation influence.
The code result is the largest, but read it carefully. It does not mean every page should contain code. It means pages where code is genuinely the right evidence format tend to be absorbed more, likely because code is unambiguous, directly reusable, and hard to paraphrase into vagueness. A technical page that shows the actual snippet gives the model something it can lift or reference precisely.
The Q&A result is the one that should sting. Many GEO guides, including plenty of well-intentioned ones, recommend converting content into FAQ blocks as a default move. In this dataset, Q&A pages scored slightly lower than non-Q&A pages. The paper's explanation is that Q&A formatting is a surface wrapper. If the answers underneath are short and thin, the format adds nothing. A question mark in a heading is not evidence.
Semantic fit beats length
The strongest independent correlation with influence was not word count. It was LLM relevance score (r = 0.4322), followed by answer-citation embedding similarity (r = 0.3561) and LLM content quality (r = 0.2917).
Structure and length still mattered. Top-quartile pages averaged 1,943 words versus 170 for bottom-quartile pages, with 10.6 headings versus 0.85 and nearly nine times the list density. But the paper is careful: high-influence pages are "not merely longer." They are longer and more modular and more semantically aligned. Length without usable structure is just more words.
Definitions and comparisons are the highest-value roles
When the researchers classified how each citation was used, two roles stood out.
Semantic role | Citations | Mean influence |
|---|---|---|
Definition | 1,663 | 0.1531 |
Comparison | 1,719 | 0.1524 |
Evidence | 6,216 | 0.1235 |
Statistical data | 504 | 0.1120 |
Example | 1,468 | 0.1047 |
Opinion | 846 | 0.0938 |
Background | 5,582 | 0.0801 |
Procedure | 497 | 0.0717 |
Reference | 1,298 | 0.0529 |
Definitions and comparisons shaped answers most. Reference-only citations, the kind where you are listed as a source but contribute no substance, were the weakest by a wide margin.
If you want to shape answers, supply the thing the answer needs: a clean definition, a structured comparison, a specific number. Being present is not the same as being useful.
News gets cited a lot and absorbed less
Domain type produced another split. News media appeared frequently in citation pools but averaged only 0.0726 influence. Encyclopedia pages averaged 0.2144, nearly three times higher.
News is good at establishing that something happened. It is less good at explaining what it means, how it compares, or what to do next. Answer engines often need both, and they pull the explanatory layer from somewhere else.
For brands, this is a warning against chasing news-style coverage and assuming it translates into answer influence. Being the source that reported the announcement is not the same as being the source that explains the category.
Why the platforms behave so differently
The study describes three distinct archetypes in this snapshot.
ChatGPT is citation-sparse and absorption-heavy. It cites fewer sources per prompt, but the ones it picks score much higher influence. One plausible reading is that ChatGPT compresses more synthesis internally after selecting a smaller evidence base. It may also reflect how its citations are rendered or parsed. The paper flags both possibilities and refuses to pick one.
Google AI Overviews is broad and shallow. It cited 12.06 sources per prompt on average and showed a strong English-language advantage (11.57 citations for English prompts versus 7.53 for Chinese). Its strongest signals were answer-citation and question-citation embedding similarity, plus definition markers.
Perplexity is citation-rich and coverage-oriented. It cited 16.35 sources per prompt, triggered search on 100% of observed prompts, and its average absorption sat closer to Google than to ChatGPT.
A single universal GEO recipe is unlikely to work. The same content feature can behave differently across engines, and the paper explicitly warns against treating these profiles as permanent platform laws. AI search products change fast.
What to do about it
The study's framework points to a two-layer approach: earn selection, then earn absorption.
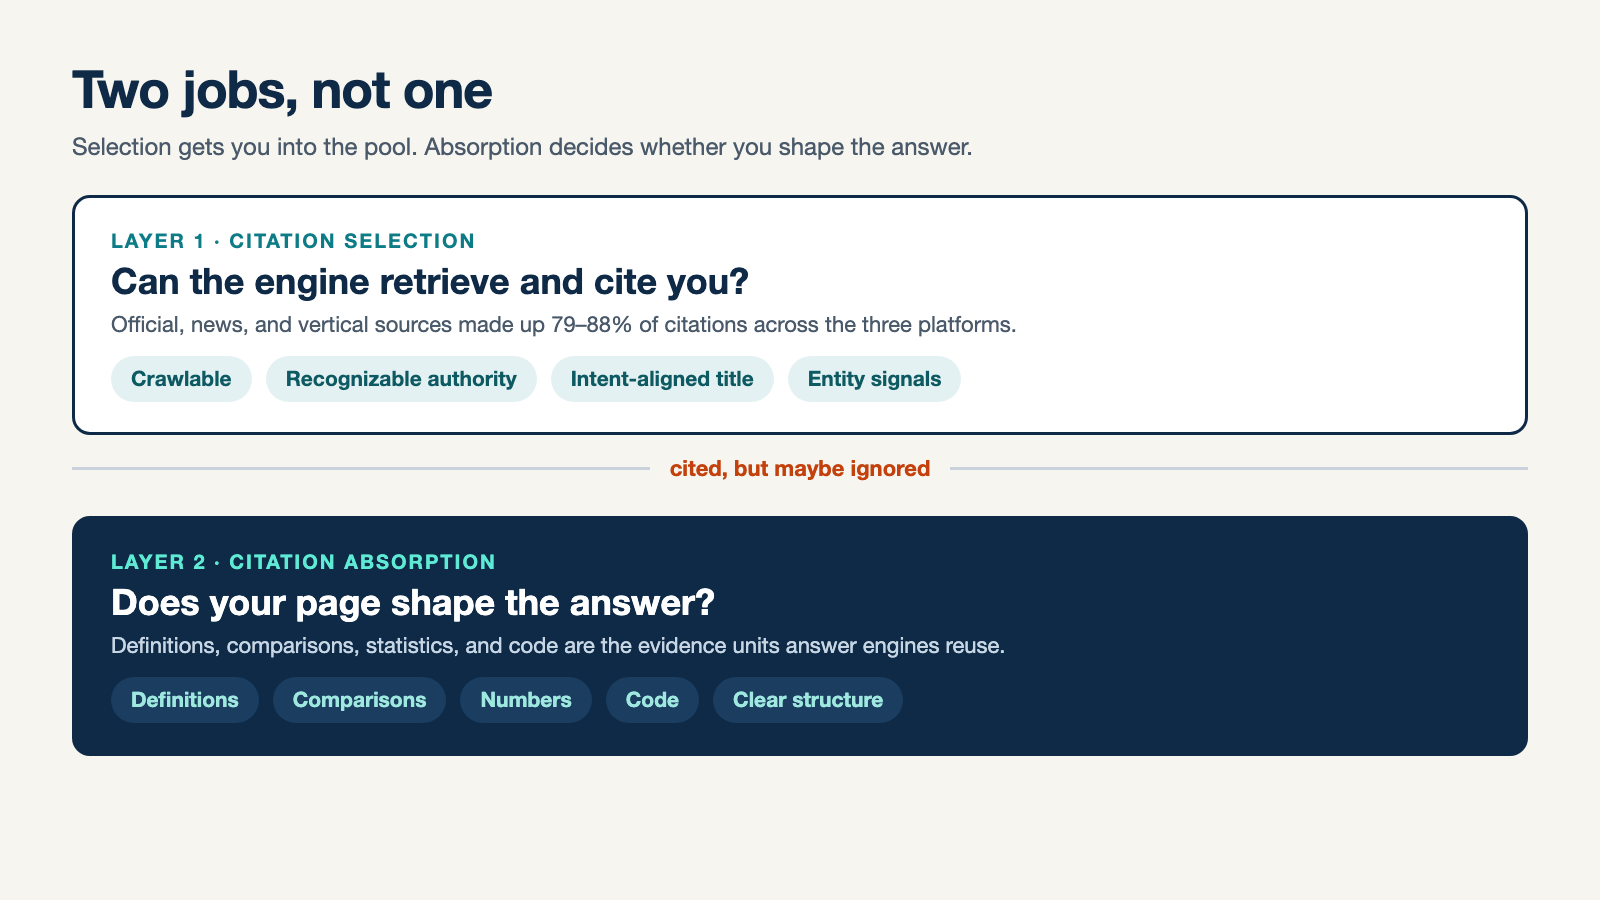
Selection gets you into the pool. Absorption decides whether you shape the answer.
Layer 1: Get into the citation pool
Selection is still gated by recognizable authority. Official, news, and vertical sources made up 79% to 88% of citations across the three platforms. Median domain rating for cited pages sat between 526 and 592 on the study's scale.
That does not mean small sites are locked out, but it does mean the entry conditions are real. To improve selection odds:
- Make pages crawlable and fetchable. The absorption analysis only covered pages that were successfully fetched. If a bot cannot retrieve your content, nothing downstream matters.
- Align titles and metadata with the actual query intent, not a keyword variant.
- Publish where the engines already look for your category: official documentation, recognized vertical sources, and credible editorial environments.
- Build the entity signals that make your domain recognizable as a source for the topic.
Layer 2: Become worth absorbing
Once you are in the pool, absorption depends on whether your page contains reusable, semantically aligned evidence. The paper calls this evidence-container design. A good evidence container has:
- A clearly bounded topic, not a diffuse collection of loosely related claims
- Headings that mirror the subquestions a user would actually ask
- Paragraphs that each carry one distinct, extractable claim
- Concrete evidence: definitions, numbers, comparisons, examples, procedures, and caveats
- Traceable sources for factual claims
Here is how that translates into page-level changes.
Add the number, not just the claim. "Response times improved significantly" is weak. "Median response time dropped from 840ms to 310ms across 12,000 requests" gives the model something to carry into the answer. The statistics finding (+61.6%) is the most portable lesson in the study.
Write a real definition. Definition-role citations had the highest mean influence. If your page is about a concept, include a tight, standalone definition near the top that a model can lift without losing meaning. Do not bury it in three paragraphs of preamble.
Build comparison tables. Comparison-role citations were essentially tied with definitions at the top. If your topic involves choices, give the reader and the model a structured table with clear criteria. This article is doing that deliberately.
Show the code or the exact procedure when it applies. The code result (+76.9%) is the largest in the dataset. If you are writing technical content, include runnable or copyable examples rather than describing them abstractly.
Stop treating FAQ blocks as a strategy. Keep FAQs when they answer genuine questions. Do not convert an entire article into question-and-answer format and expect that alone to improve absorption. The evidence has to live inside the answers.
Use headings to expose the skeleton. Top-quartile pages averaged 10.6 headings versus 0.85 for bottom-quartile pages. Headings are how a model maps your page to the subquestions in a prompt. Write them as descriptive statements of what each section delivers.
How to measure absorption, not just citations
The study's most useful operational contribution may be the measurement model. It proposes a publisher dashboard with at least five metrics instead of one visibility score:
Metric | What it answers |
|---|---|
Selection rate | Does your page appear in citation pools for target prompts? |
Citation breadth | How many citations appear per prompt, and how often does your domain recur? |
Absorption score | How much does your page appear to shape the answer? |
Support quality | Do cited pages actually substantiate the generated claims? |
Coverage equity | Is visibility concentrated in a few domains or spread across credible long-tail sources? |
The dashboard should also separate prompt families. A page that performs well on "what is" prompts may fail on comparison or how-to prompts. The study found comparison questions had the highest mean influence, which suggests comparison content should be evaluated under comparison prompts, not generic brand queries.
And it should track time. A one-time audit tells you where you stood on one day. Generative engines change, so repeat the same prompt panel at fixed intervals and log the model version and interface mode where you can.
If you want a starting point for prompt-level tracking, Auspia's AI Search Visibility Checker lets you run a query set and see where your brand and pages show up.
What the study does not prove
It is worth being as disciplined as the paper is about its own limits.
The influence_score is built from the same textual signals it is used to explain. The authors explicitly warn against regressing influence on its own components, which would be circular. The correlations here are descriptive, not causal.
The prompt set was designed, not randomly sampled from real user behavior. The language contrast covers only Chinese and English. The data is a static snapshot without unified record-level timestamps, so it cannot show how these patterns change over time.
Most importantly, no one has yet run the controlled experiment. The study lays out a confirmatory plan, but until someone rewrites pages under controlled conditions and measures the result, "add statistics and definitions" is a well-supported hypothesis, not a guaranteed lever.
That is not a reason to ignore it. It is a reason to test it on your own pages rather than treating any single study as a universal law.
The practical shift
Citation dashboards answer a narrow question: did we show up? That is useful, but it is an exposure metric. It tells you whether you got through the door.
Absorption asks a harder and more valuable question: did we change what the answer says?
The evidence in this study suggests the second question rewards different work. Pages that carry definitions, numbers, comparisons, code, and clear structure, aligned tightly with what users actually ask, are the ones that seem to shape answers.
Build pages that are worth absorbing. Then measure whether they were.
Author: Isabel Grant, Researcher of 2,000+ AI Citation Patterns at Auspia. Isabel writes about citation earning, source quality, and retrieval behavior in AI search.