

What Google shipped on September 24, 2026
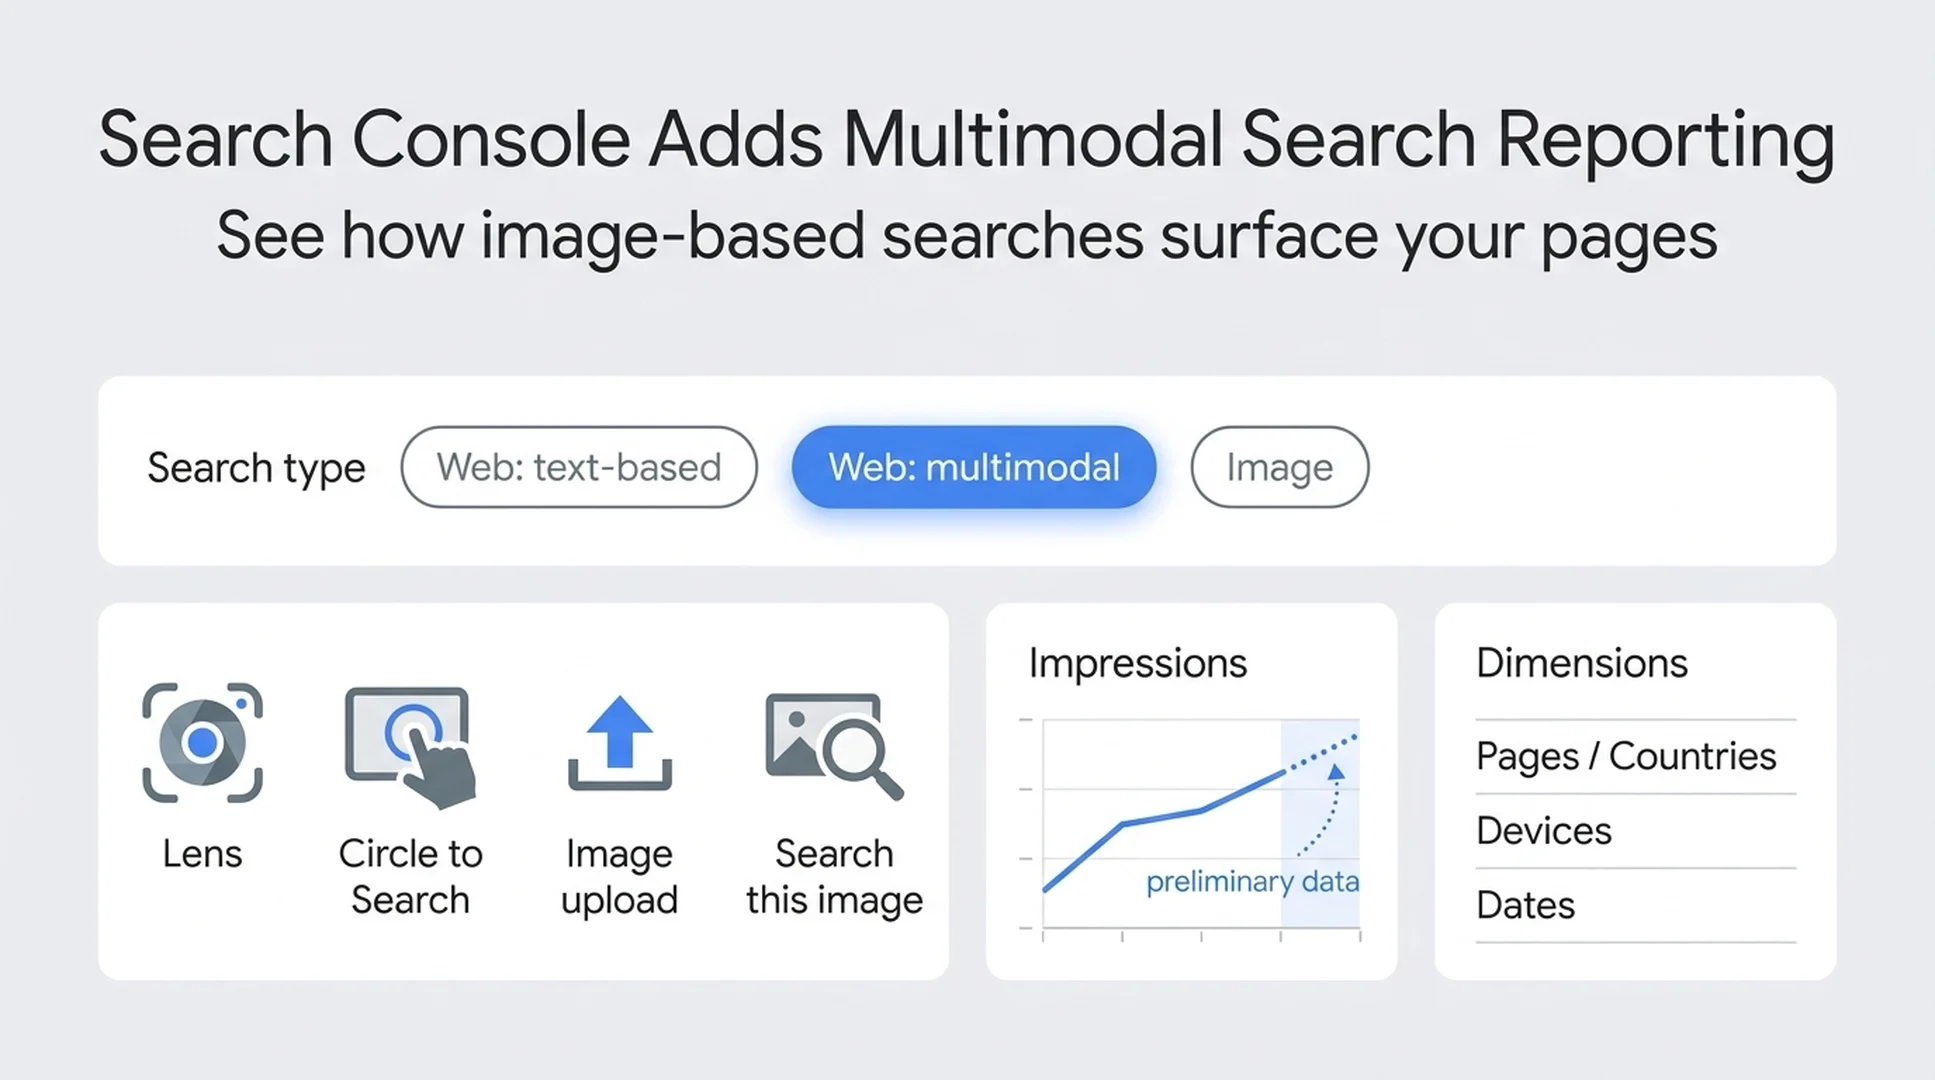
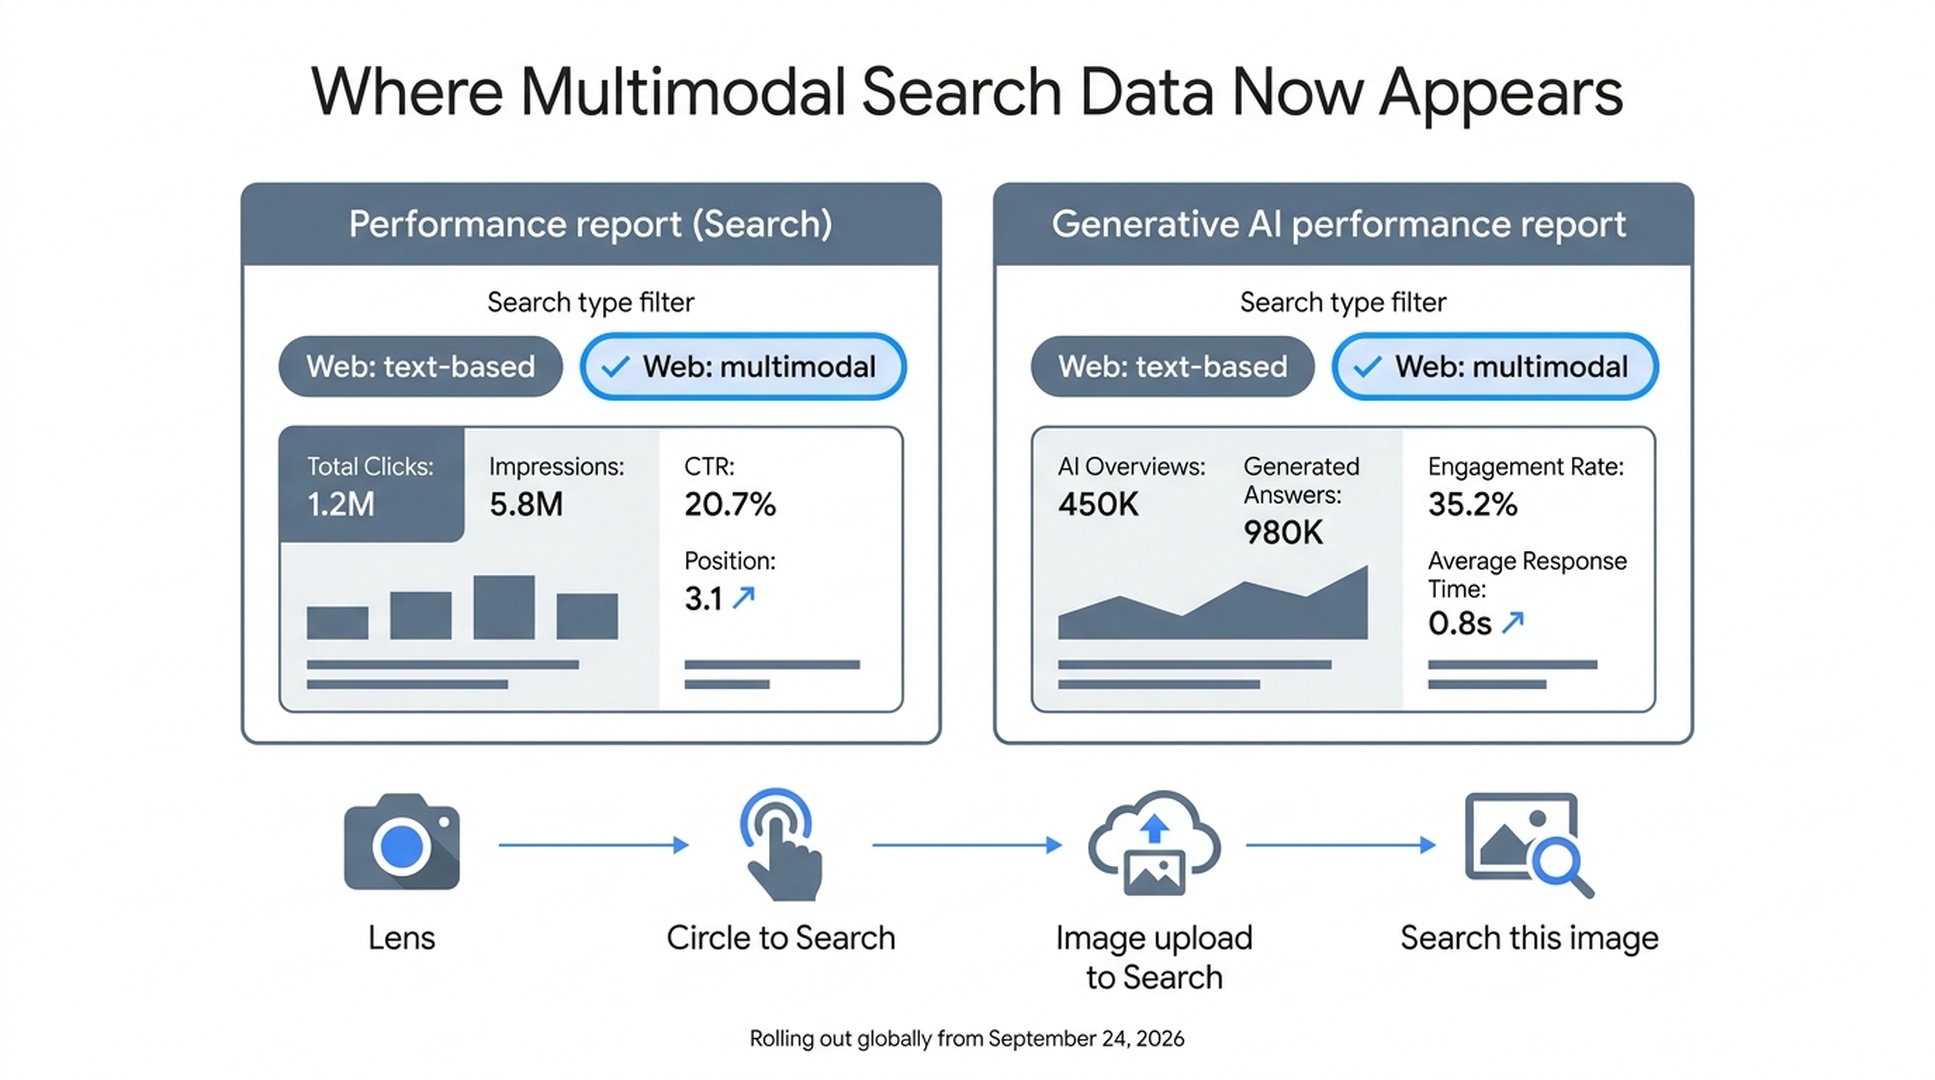
Google added a new multimodal search type to Search Console's performance reporting. It appears in two places: the standard Performance report for Search results, and the separate Generative AI performance report.
The filter isolates web results that were triggered by an image rather than a typed query. According to Google's announcement, that includes four surfaces:
- Google Lens
- Circle to Search on Android
- Image uploads to Google Search
- The Chrome right-click "Search this image" option
The rollout is global and started the day of the announcement. You will only see the filter populated if your site is already receiving traffic from these queries. If the row is empty, that is a data signal, not a bug.
Google's Search Console help documentation describes the filter this way: Web: multimodal includes web search results where an image was used as part of the search, while Web: text-based covers traditional traffic from text queries in the standard search bar.
Where the data shows up, and what it will not tell you
The same filter now exists in two reports that used to answer different questions. That matters because the two reports count different things.
Report | What it measures | Search type filter |
|---|---|---|
Performance report (Search) | Clicks, impressions, average CTR, average position |
|
Generative AI performance report | Impressions only, inside AI Overviews and AI Mode |
|
Three limits matter before you build anything on top of this data.
The first is that it is impressions-first. The Generative AI performance report documents impressions as its core metric, so treating multimodal impressions as a traffic forecast will overstate what you are actually getting.
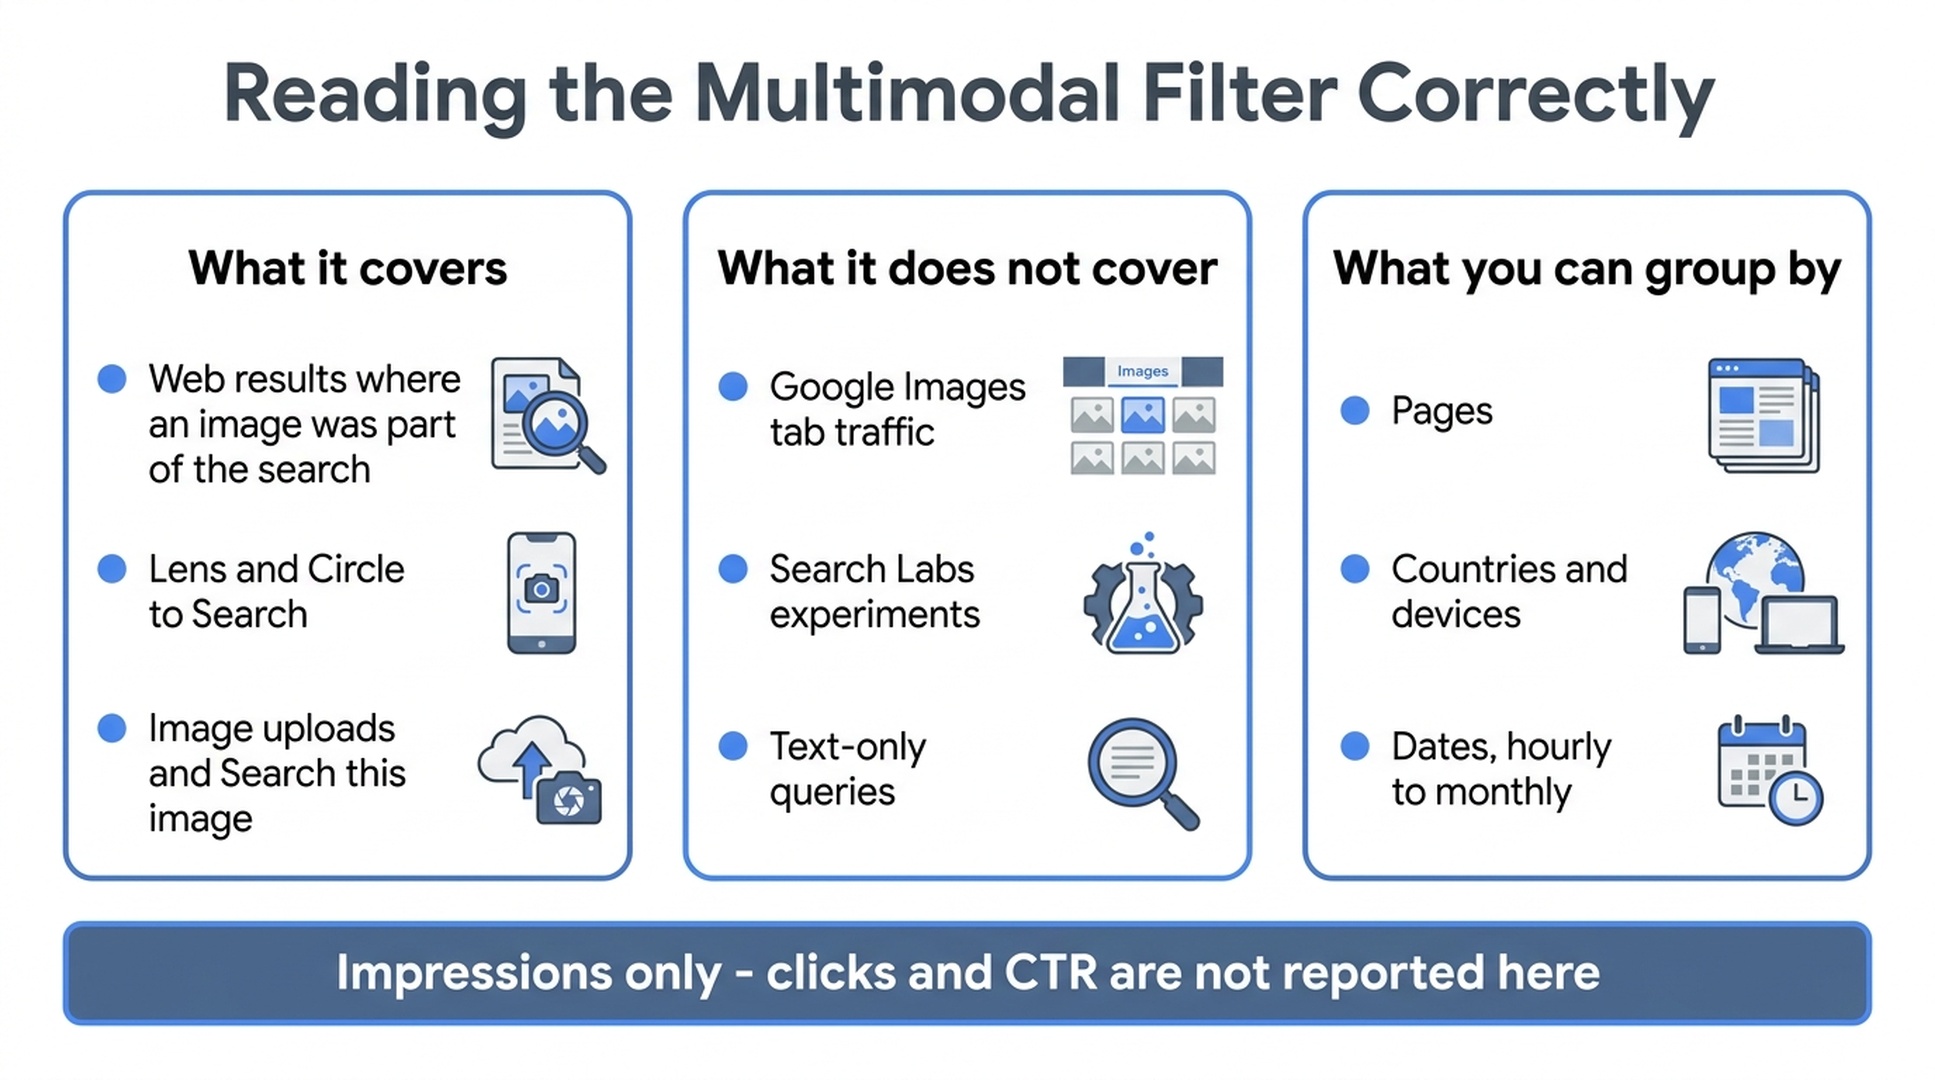
The second is that it is not the Images tab. This filter covers web results where an image was part of the search. Traffic from the Google Images tab is a separate search type.
The third is that Search Labs is excluded. Google states that experiments in Search Labs are not included in the Generative AI performance report. If you are testing something there, it will not show up.
The standard data limitations still apply: the 1,000-row table cap, Pacific Time dates, and preliminary data marked with a dotted line on the chart. Exported values that show as ~ or - in the interface come through as zeros in the download.
Why this changes the visual-asset conversation
Most teams treat images as a supporting asset for a page. Alt text gets written in a hurry, filenames stay as IMG_4471.jpg, and nobody owns the question of whether the image itself communicates anything.
Multimodal reporting puts a number on that neglect. Once you can filter impressions by image-initiated searches, you can separate two very different situations that used to look identical in aggregate:
- A page that earns text impressions and nothing from images
- A page that earns image impressions and converts poorly from text
Those two profiles need opposite fixes. The first is a visual-content problem. The second is usually a page-experience problem.
One second-order effect is worth watching. Google has been explicit that AI Overviews and AI Mode impressions are now visible in their own report, and that multimodal data feeds into both the standard and generative AI views. As image-initiated queries grow, the visual layer of a page becomes an entry point into AI-generated answers rather than decoration.
That does not mean every page needs a custom illustration. It means the pages where a visual genuinely answers the query are now identifiable, which they were not before.
A 30-minute audit you can run this week
You do not need a new tool for this. You need the export and a spreadsheet.
- Pull the baseline. Open the Performance report, set the search type filter to
Web: multimodal, and export. Do the same forWeb: text-based. Keep both files. - Find pages that only appear in one file. A page with multimodal impressions and no text impressions is doing something visually interesting. A page with the opposite profile is probably relying on text to carry a query that has a visual answer.
- Check the query dimension. Google notes that table aggregation differs by dimension: queries, countries, devices, and dates aggregate by property, while pages and search appearance aggregate by page. Read the query list with that in mind before drawing conclusions about a single URL.
- Open the top multimodal pages and look at the images. Ask three questions. Does the image answer the query on its own? Is the filename descriptive? Does the alt text describe the content or just repeat the title?
- Write down one change per page. Not a redesign. One change: a better image, a clearer caption, or alt text that actually describes what is in the frame.
- Set a review date 30 days out. Multimodal impressions are new data on a new surface. A single week will not tell you anything useful.
If you want a faster read on whether your pages are set up for image-led discovery at all, the AI Search Visibility Checker will show you how your pages surface in AI answers, which is where a growing share of image-initiated queries end up.
The scope boundary, in one table
Question | Answer |
|---|---|
Does it report clicks? | Yes in the Performance report, no in the Generative AI report |
Does it include Google Images tab traffic? | No, that is a separate search type |
Does it include Search Labs experiments? | No |
Can I segment by country and device? | Yes, in both reports |
When did it start? | September 24, 2026, global rollout |
What if I see no data? | Your site is not receiving traffic from image-initiated queries yet |
What to watch over the next quarter
Two things will tell you whether this filter earns a permanent slot in your reporting.
First, whether multimodal impressions grow as a share of total impressions. A flat line means image-initiated search is not a meaningful channel for your site yet, and you should not reorganize your content plan around it.
Second, whether the pages that win multimodal impressions are the pages you would have predicted. If they are not, your internal model of which assets are visually useful is wrong. That is worth knowing on its own.
Do not build a multimodal KPI before you have a baseline. Export the two files, run the audit, and revisit in 30 days.
FAQ
Is the multimodal filter available to everyone? The rollout is global, but the filter only populates for sites receiving traffic from image-initiated queries. An empty report means no matching traffic, not a permissions problem.
Does this replace the Generative AI performance report? No. It adds a search type filter to that report. The Generative AI report still covers AI Overviews and AI Mode impressions separately.
Can I see which specific images drove impressions? Not directly. The filter segments by search type, and the available dimensions are pages, queries, countries, devices, and dates. You can narrow to a page, but not to an individual image file.
Why do my chart totals differ from my table totals? Google documents this as an aggregation difference: chart data aggregates by property, while page-level table data aggregates by page. The same discrepancy guidance from the standard performance report applies here.
Should I optimize for multimodal search separately from SEO? Treat it as a lens on the same work, not a separate program. The underlying assets are your pages and their images. What changes is that you can now see whether the visual layer is contributing.
Author: Julian Mercer, 14-Year Technical SEO Practitioner at Auspia. Julian writes about crawlability, schema, rendering, and the technical foundations that make content readable to both search engines and AI systems.