

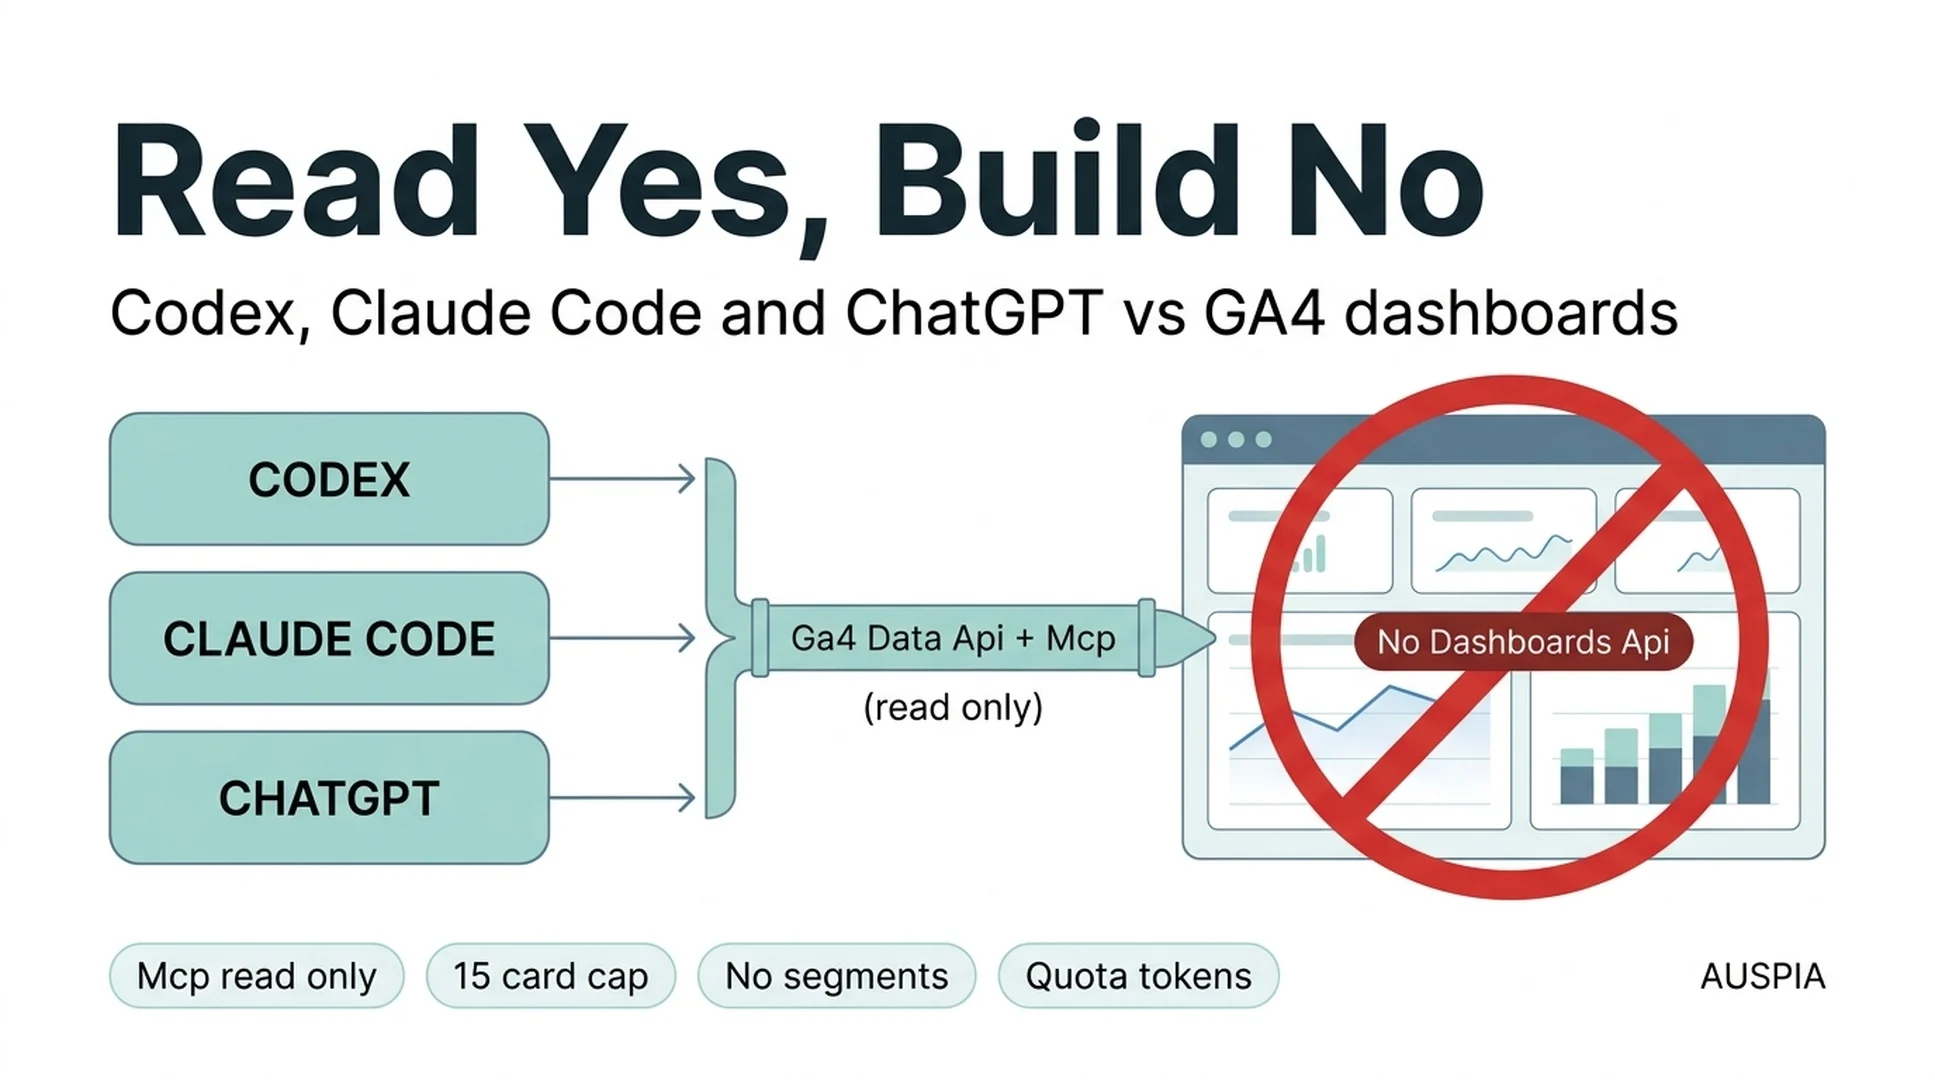
None of the three can build your Google Analytics dashboard. Codex cannot create one, Claude Code cannot edit one, and ChatGPT cannot publish one to the property's left navigation. That is not a limitation of those tools. It is a limitation of the dashboards feature itself.
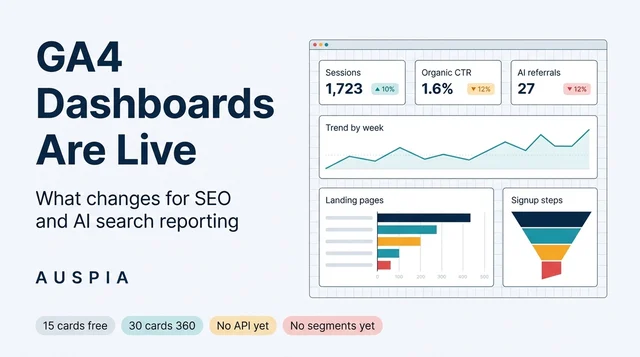
Google's own documentation is explicit. Dashboards arrived on September 9, 2026, with a clear list of unsupported features: API support, segments, and card-level comparisons.
So the interesting question is not whether an AI coding agent can do the whole job. It cannot. The useful question is where the handoff sits, because the work either side of that handoff is now largely automatable, and the work in the middle is a five-minute human task.
The short answer
Task | GA4 path | Can an agent do it? |
|---|---|---|
Create, edit, or publish a dashboard | In-product UI only | No |
Read report data | Data API, Analytics MCP server | Yes |
Change property configuration | Admin API | Yes |
Apply a segment inside a dashboard card | Not supported | No |
Compare metrics inside one card | Not supported | No |
Calculate a weekly digest from the data | Any script the agent writes | Yes |
Replace the dashboard with an API-built report | Data API plus your own rendering | Yes, outside GA |
Read that table from the top. The two rows that say "Yes" are where the leverage is, and the two rows that say "No" are why a human still owns the dashboard canvas.
Why the boundary sits exactly where it does
Google exposes three programmatic surfaces to Google Analytics, and only one of them is designed for AI assistants.
The Analytics MCP server is Google's official bridge between GA4 data and a large language model. The documentation describes it as a way to "chat with your data, build custom agents with access to your data, and more." It also carries a one-line warning that decides most of this article: the MCP server is available for read requests only and cannot edit your Analytics configuration or settings. There is a hosted endpoint for the Data API at analyticsdata.googleapis.com/mcp/v1, and Google publishes an experimental local server as well.
The [Data API](https://developers.google.com/analytics/devguides/reporting/data/v1) is the reporting interface. Google positions it for building custom dashboards, automating reporting, and integrating Analytics data with other tools. Read that sentence carefully, because it is where most of the confusion starts: the Data API lets you build dashboards, in your own stack, with your own rendering layer. It does not let you build the dashboards inside the Google Analytics product.
The [Admin API](https://developers.google.com/analytics/devguides/config/admin/v1) handles configuration rather than reporting. It covers properties, data streams, custom dimensions and metrics, access, and links. It has no dashboards resource.
Put those together and the shape is clear. An agent can read the numbers and can change the plumbing that produces them. It cannot touch the presentation layer that Google shipped in September.
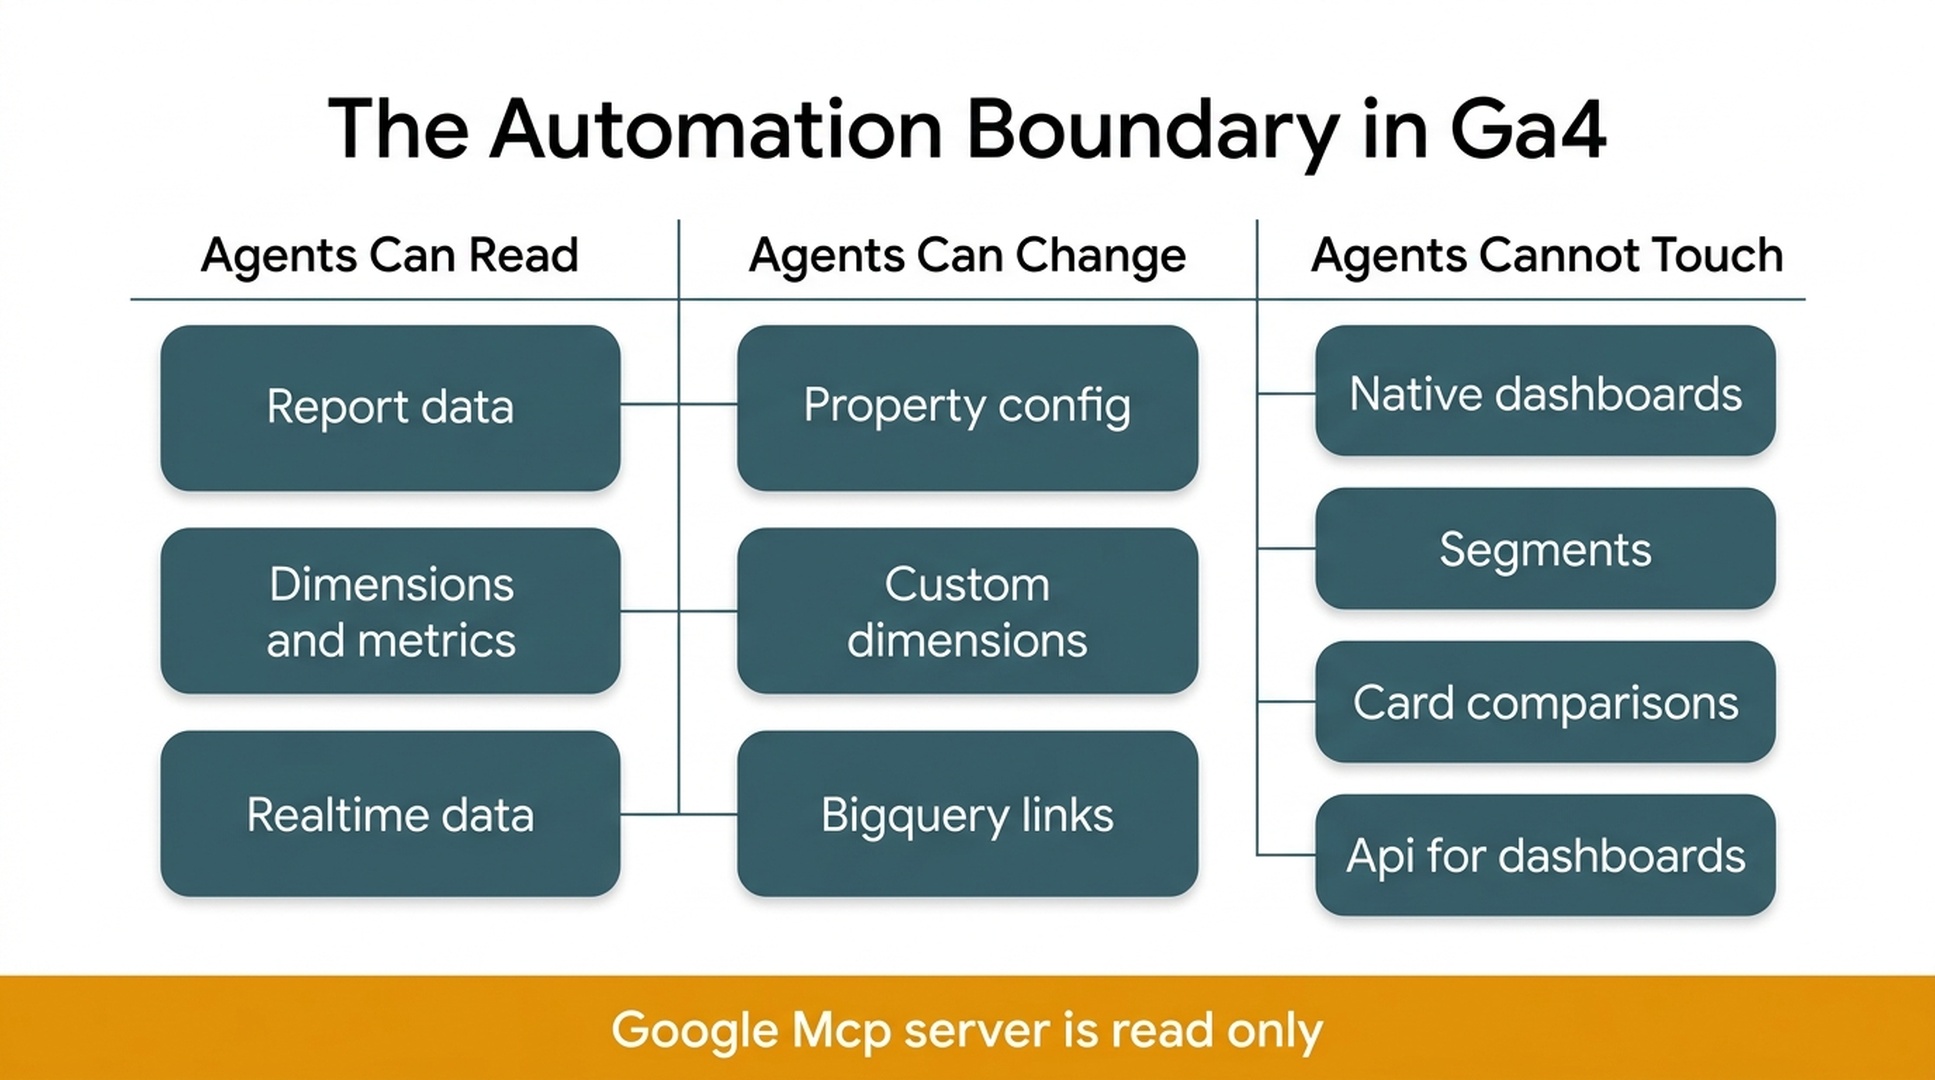
Three surfaces, three permission levels. Google's MCP server sits on the read-only side.
Three agents, judged by where the work lands
Codex, Claude Code, and ChatGPT are often compared as if they were three versions of the same tool. For analytics reporting, the useful distinction is not which model is smartest. It is where the artifact lives at the end of the session.
Codex | Claude Code | ChatGPT | |
|---|---|---|---|
Typical working surface | A repository on disk plus command execution | A repository on disk plus command execution | A conversation, with a code sandbox and uploaded files |
Strongest report artifact | Versioned scripts, scheduled jobs, checked-in query definitions | The same, plus connector setup through MCP servers | One-off analysis and a written answer |
Reviewability | Diffs in a pull request | Diffs in a pull request | Transcript only, unless you export the script |
Best fit for GA4 work | Pipeline code that must be maintained and reviewed | Wiring a GA4 connector and iterating on a script until it runs | Structural questions, sanity checks, and drafting the commentary |
The practical split is simpler than the table. If the deliverable must survive next quarter, put it in a repository and use one of the two repository-resident agents. If the deliverable is a decision you need today, hand the extract to a chat assistant and treat the answer as provisional.
Two clarifications worth making before you delegate anything.
First, all three can write the same SQL-shaped or JSON-shaped query. The differentiator is not query writing, it is whether the artifact can be reviewed, versioned, and re-run next month by someone who was not in the room.
Second, none of them can see your dashboard. An agent has no view of the canvas, the card layout, or the visual result. It only knows what the API returns. That gap is where most reporting disagreements come from.
The split of labour that works
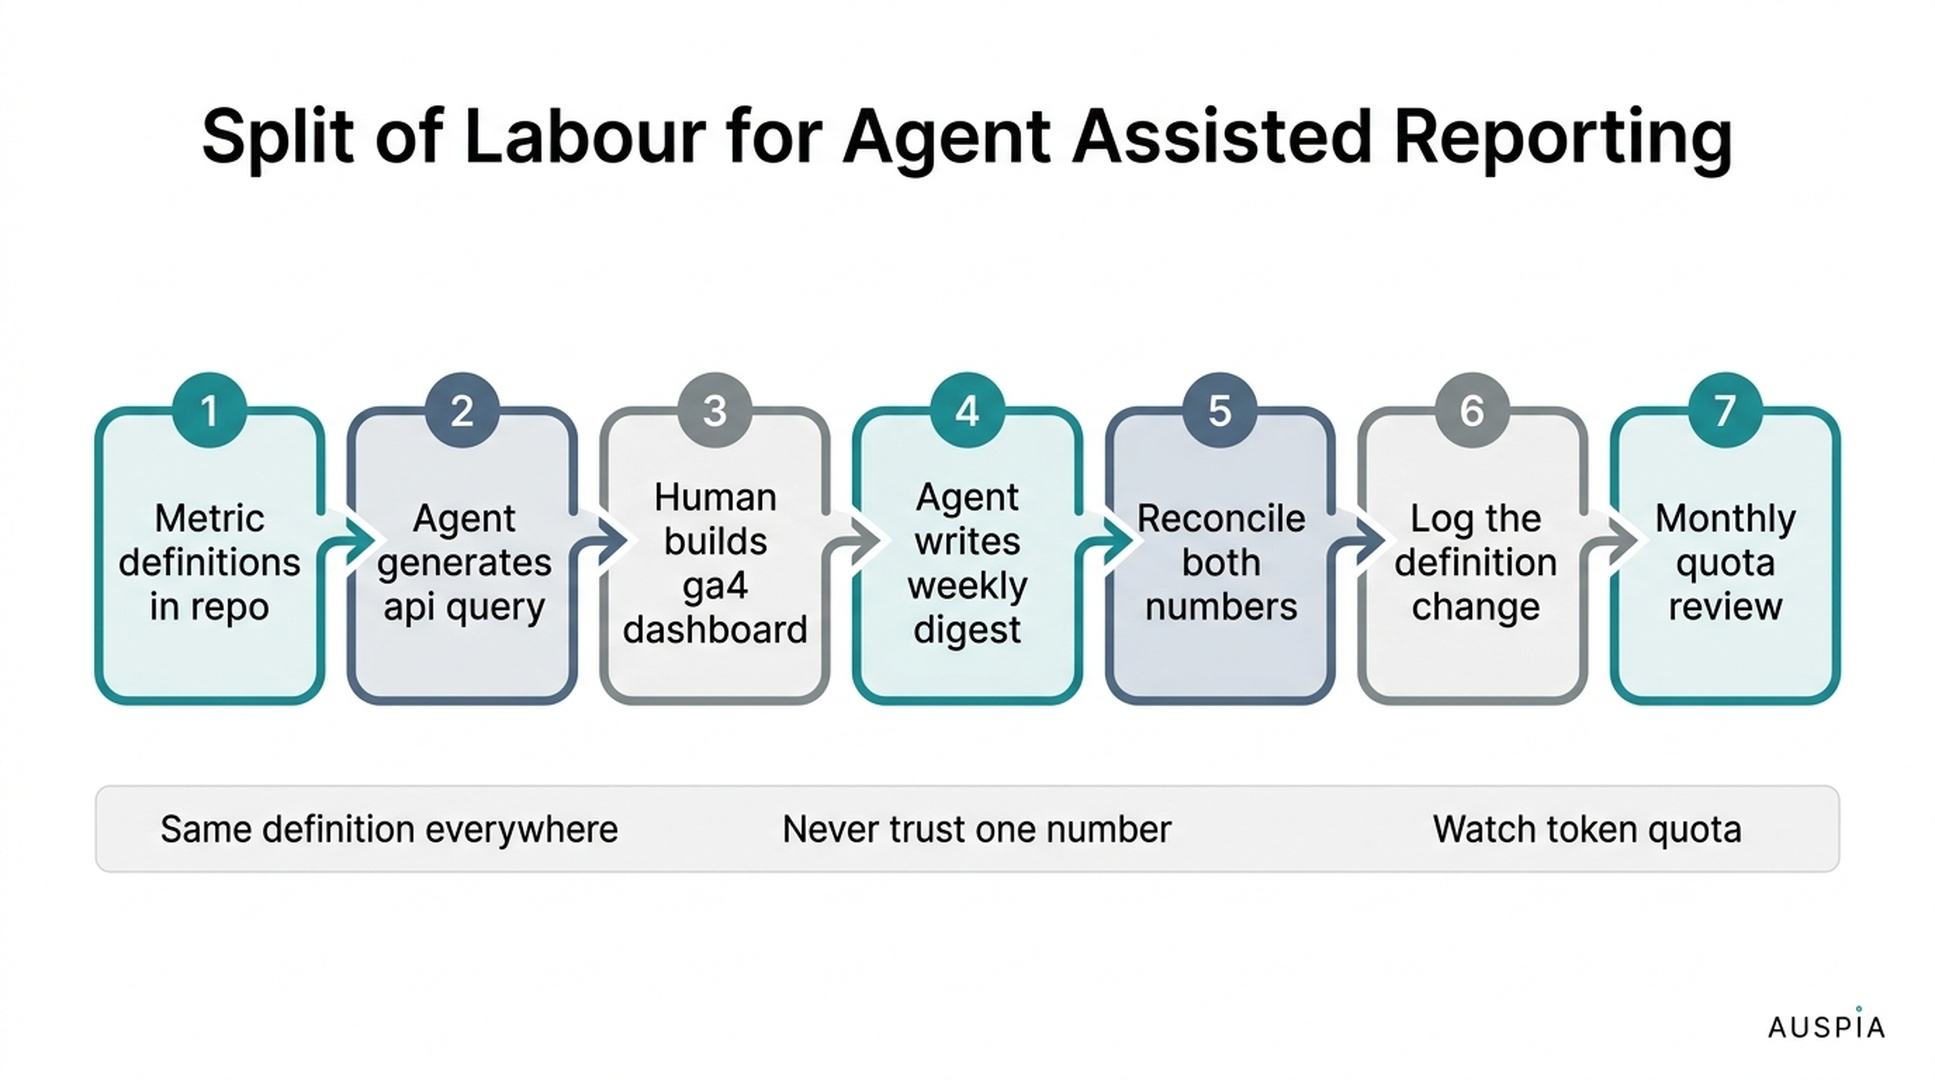
The handoff in step three is not a compromise. It is the part of the process that keeps the numbers owned by a person.
- Keep metric definitions in the repository. One file listing each metric, its exact GA4 API name, its date handling, and its owner. Without this file, the agent invents a definition and the dashboard uses another.
- Have the agent generate the query, not the conclusion. Ask for the Data API request body, the dimension and metric names, and the date range. Review that object the way you would review a formula.
- Build the GA4 dashboard by hand, from the same definitions. Fifteen cards on a standard property is a small budget, so choose the cards that answer questions rather than the cards that are easy to add.
- Let the agent write the weekly digest. Commentary on numbers the agent can read is safe work. Commentary on numbers it cannot verify is not.
- Reconcile the two outputs on a schedule. Compare one card against one API query, every month, and record the difference. Silent drift between a dashboard and a script is the most common failure in this setup.
- Log every definition change with a date. When a metric definition changes, both the dashboard owner and the query author need to know on the same day.
- Review quota before you scale the workflow. The Data API uses a token bucket with quotas tracked per property and per project, and standard properties carry lower limits than 360 properties.
Step three is the one teams try to skip, and it is the one that keeps the process honest. A dashboard that a person assembled from written definitions can be defended in a meeting. A dashboard nobody remembers building cannot.
Four ways this goes wrong
The agent invents a metric. API metric names are not the same as the labels you see in the interface, and a plausible-sounding name is not necessarily a valid one. Validate every dimension and metric against the official reference before the query goes into production.
Quota runs out mid-quarter. The Data API enforces quotas on tokens per hour and per day, plus concurrent requests and server errors, all tracked per property. Google's own guidance suggests requesting the quota object with each call to monitor consumption. An agent that loops over fifty properties can exhaust a standard property's allowance quickly.
Credentials end up somewhere they should not. An agent working in a repository will happily reference a service account file that is sitting in the project directory. Scope access to read-only where the task only reads, keep the key out of the repository, and treat query history as data that needs a home.
Two number systems appear. The dashboard says one thing, the script says another, and nobody can say which is right. This is not a technical problem. It is a symptom of having no single definition file, and it is why step one exists.
Before you trust an agent number
- Confirm the definition matches. Same metric, same date range, same time zone, same property.
- Confirm the surface. An agent querying through the API and a card rendered in the interface are produced by different systems, even when they agree.
- Check thresholding and sampling behaviour on large or high-cardinality dimensions before you quote a percentage.
- Check remaining quota when a report is generated in a loop.
- Re-read the delivered artifact, not the summary. A confident paragraph at the end of a session is not evidence that the query was correct.
Auspia's take
This boundary is healthier than it first looks. Google has given agents a read-only door into Analytics data and left the presentation layer as a deliberate human artifact, and the practical result is that automation lands where review is possible: in repositories, in pull requests, in scheduled digests.
The teams that get value from this will be the ones that treat the dashboard as a small, curated, human-built surface, and treat everything around it as code. The teams that struggle will be the ones that ask an agent to reproduce a twenty-card report from memory and then argue about the two numbers that do not match.
One consequence is worth planning for now rather than later. Once the numbers are generated by scripts, the definitions become the most valuable document your reporting has. Write them down before you automate them.
What to do this week
- Write the definition file for your five most-quoted metrics. Include the exact API names, and give each metric an owner.
- Run one Data API query and one dashboard card side by side, then reconcile them. Fix the definition, not the number.
- Check your Data API quota usage with the quota object enabled, so you know your ceiling before you schedule anything.
FAQ
Can an AI agent create a Google Analytics dashboard for me? No. Google's documentation lists API support as unsupported for dashboards, so creation, editing, and publishing happen in the interface. An agent can produce the data and the query behind each card.
Does Google's Analytics MCP server let an agent change my GA4 property? No. Google states that the MCP server is available for read requests only and cannot edit your Analytics configuration or settings. Configuration changes belong to the Admin API, and read requests belong to the Data API or the MCP server.
If I use the Data API, do I still need the built-in dashboards? They solve different problems. The Data API gives you data you can render anywhere. The built-in dashboards give you a shared surface inside GA4 where anyone with property access can read the same cards, which is usually what a weekly review needs.
The bottom line
Codex, Claude Code, and ChatGPT are genuinely useful around Google Analytics dashboards, and none of them can build one. Keep the metric definitions in a repository, let an agent generate queries and digests, assemble the dashboard by hand from the same definitions, then reconcile the two on a schedule. That is the whole workflow, and the part a human keeps is the part that makes the numbers trustworthy.
Author: Nathan Reed, AI Marketing Workflow Designer at Auspia. Nathan writes about wiring AI tools into repeatable marketing and reporting workflows that teams can maintain.