

The Number That Matters More Than Traffic
Most website owners ask the wrong question. They ask "how much traffic should I be getting?" when they should be asking "does my traffic match my business model?"
Here is why this distinction matters: a SaaS company with 15,000 monthly organic visits can be a $10M business. A news publisher with 150,000 monthly visits can be barely breaking even. Raw traffic tells you nothing without the context of what each visitor is worth.
This article gives you both — the benchmarks AND the framework for interpreting them. All organic traffic figures below are from Ahrefs' May 2026 analysis of 422,421 real websites unless otherwise noted. Medians are used throughout because a few giant sites distort averages: in Computers & Electronics, the mean is 40× the median.
Organic Traffic Benchmarks by Industry
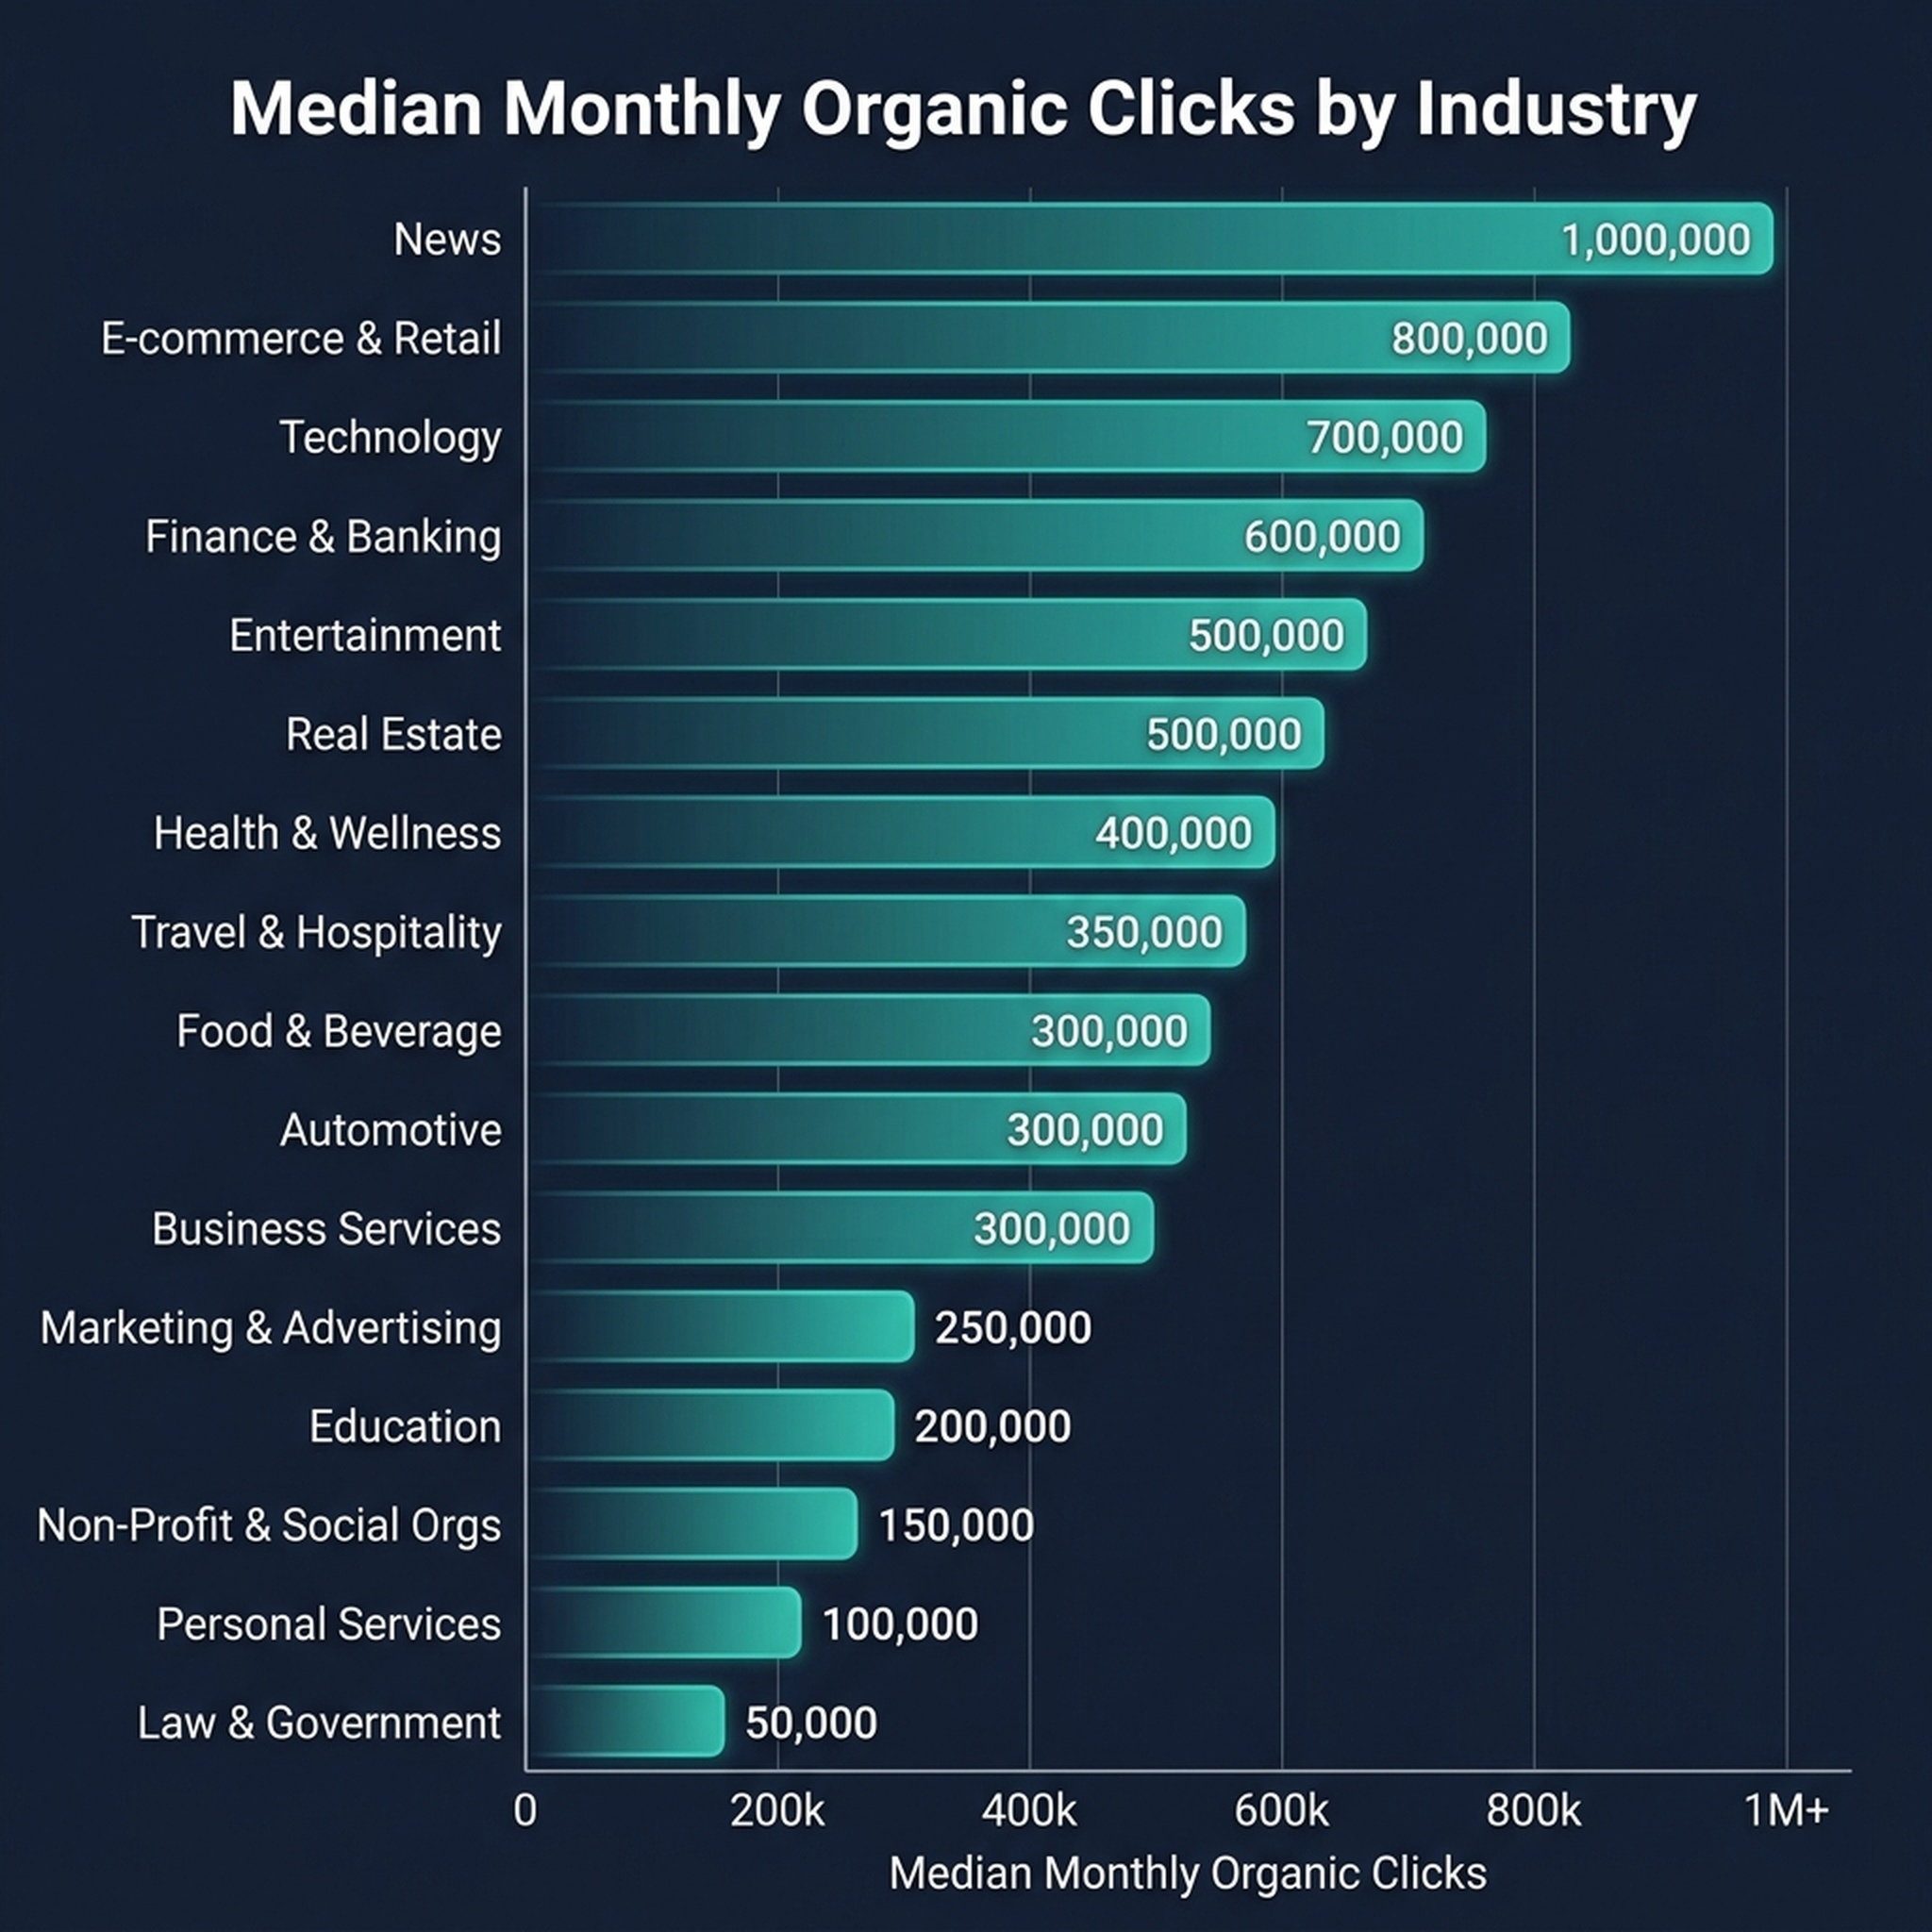
Here are median monthly organic clicks from Google, broken down by industry:
Industry | Median Monthly Organic Clicks | Typical Revenue Model |
|---|---|---|
News | 175,115 | Ads, subscriptions |
Online Communities | 112,517 | Ads, memberships |
Reference | 100,007 | Ads, authority signals |
Arts & Entertainment | 61,159 | Ads, tickets, merch |
Games | 49,828 | In-game purchases, ads |
Finance | 37,346 | Leads, transactions |
Computers & Electronics | 34,679 | Product sales, SaaS |
Shopping | 27,934 | Product sales |
Travel & Transportation | 25,990 | Bookings, commissions |
Health | 20,732 | Appointments, products |
Real Estate | 20,478 | Leads, commissions |
Jobs & Education | 20,029 | Applications, enrollments |
Beauty & Fitness | 18,362 | Appointments, products |
Home & Garden | 16,325 | Product sales, leads |
Business & Industrial | 15,637 | Leads, contracts |
Law & Government | 8,607 | Leads, retainers |
The pattern to notice: High-volume informational categories (news, reference, communities) sit at the top. Industries where traffic converts to high-value transactions (law, business services, real estate) sit at the bottom. A law firm with 8,000 monthly organic clicks can generate more revenue than a news site with 80,000 — because each click represents a potential client worth thousands, not a reader worth fractions of a cent in ad revenue.
Why Medians, Not Averages
If you take one methodological point from this article, make it this one: never benchmark against averages.
In the Computers & Electronics category, the mean organic traffic is 40× the median. A handful of sites — Apple, Microsoft, Amazon — pull the average so far upward that it becomes meaningless for everyone else. If you compared your electronics blog to the "average," you would conclude you are failing. Compare to the median, and you get an honest picture.
The same pattern holds in every industry. News has CNN and BBC. Shopping has Amazon. Finance has Investopedia. These outliers are not your peers. The median describes the typical site in your vertical — use it.
Traffic by Domain Rating
Your site's authority — measured here by Ahrefs Domain Rating (DR) — is the single strongest predictor of organic traffic. The spread is four orders of magnitude:
DR Range | Median Monthly Organic Clicks |
|---|---|
0–10 | 11 |
11–30 | 285 |
31–50 | 4,214 |
51–70 | 28,396 |
71–90 | 88,701 |
90–100 | 126,364 |
How to read this: If your DR is 25 and you are getting 500 clicks a month, you are above median — doing well for your authority level. If your DR is 55 and you are getting 2,000 clicks, you are below median — your site is underperforming its authority. The traffic gap between DR tiers is not linear; crossing from DR 30 to DR 50 typically requires years of consistent link acquisition and content investment.
Traffic by Site Size
More pages = more traffic, but not proportionally:
Pages on Site | Median Monthly Organic Clicks |
|---|---|
Fewer than 10 | 18 |
10–100 | 554 |
101–1,000 | 8,829 |
1,001–5,000 | 56,408 |
5,000+ | 244,772 |
The jump from 1,000 to 5,000 pages produces roughly a 6× traffic increase. The jump from 5,000 to 5,001 produces nothing — scale helps, but content quality and topical focus determine whether those pages actually rank. Most sites with 5,000+ pages are either publishers, ecommerce stores, or large SaaS platforms with programmatic pages.
Traffic by Acquisition Channel
Organic search is the largest channel for most sites, but the mix varies by industry:
Channel | Share of Total Traffic (Median Across All Industries) |
|---|---|
Organic Search | 53.3% |
Direct | 22.1% |
Paid Search | 14.6% |
Social | 5.2% |
Referral | 3.1% |
1.7% |
Industry-specific splits that matter:
- B2B SaaS: 55–65% organic, 20–25% direct. Healthy SaaS sites run 75–80% non-branded organic traffic — if your non-branded share is below 70%, you are over-reliant on people searching for your company name.
- Ecommerce: 40–55% organic, 20–30% paid search (fastest-growing channel at +76% YoY), 10–15% direct.
- Local services: 70–80% organic, 10–15% direct, minimal paid.
A traffic source mix heavily skewed toward direct traffic usually means strong brand recognition — or an analytics setup that is misattributing organic traffic. Check your UTM tagging before celebrating a high direct-traffic percentage.
2026 Trends: Which Industries Are Growing, Which Are Declining
Not all industries are moving in the same direction. AI Overviews and changing search behavior are reshaping organic traffic patterns:
Industry | YoY Organic Traffic Trend | Primary Driver |
|---|---|---|
SaaS | +12% | Long-tail keyword expansion, topical clusters |
Local Services | +9% | Local pack growth, mobile searches |
Ecommerce (transactional) | +7% | Product-page intent, zero-click immunity |
B2B Services/Agencies | +6% | Steady demand, niche specialization |
Digital Marketing | ~0% (flat) | High competition offsets demand growth |
Ecommerce (informational) | -5% | AI Overviews absorbing informational queries |
Healthcare | -8% | AI Overviews on medical queries |
Finance/Legal | -11% | AI Overviews + increased regulation |
News/Media | -18% | AI Overviews, zero-click, platform shifts |
The pattern: Industries where the SERP can fully answer a query (news, health information, legal definitions) are losing organic traffic to AI Overviews. Industries where the SERP cannot complete the user's task (buying a product, booking a service, using a tool) are holding or growing.
SaaS is the standout: sites using topical authority clusters — interlinked content hubs covering a subject deeply — see 31% more organic sessions than those publishing isolated articles.
B2B and SaaS: The Traffic Model That Looks Different
B2B and SaaS traffic benchmarks look low compared to publishing or ecommerce — but that is the point. These are high-consideration purchases where one visitor can be worth thousands:
SaaS Tier | Monthly Organic Sessions | Typical ARPU |
|---|---|---|
Early-stage / bootstrapped | 1,000–5,000 | $50–200/mo |
Growth-stage | 5,000–25,000 | $200–1,000/mo |
Established / mid-market | 25,000–100,000 | $1,000–5,000/mo |
Enterprise / public | 100,000–1,000,000+ | $5,000–50,000+/mo |
Key SaaS traffic health metrics:
- Non-branded organic share: Should be 75–80% of total organic. Below 70% means your content strategy is not reaching new audiences.
- Conversion rate: B2B SaaS landing pages convert at 2–3% median (top quartile: 8–12%). Free trial → paid: 15–25%.
- Traffic-per-employee: Roughly 30–80 organic sessions per employee per month. Below 15 signals the site is underperforming its company size.
For B2B services and agencies, the benchmark range is 1,000–15,000 organic sessions per month, growing roughly 6% YoY. An agency with 5,000 monthly organic sessions and a 2% conversion rate is generating ~100 qualified leads per month from SEO — enough to sustain a small-to-midsize firm.
How to Tell If YOUR Traffic Is Good
Use this four-step diagnosis instead of comparing your raw numbers against industry averages:
Step 1: Find your baseline. Look up your industry, DR range, and site size in the tables above. Write down the median. This is your realistic benchmark — not the industry "average" and not the top performer.
Step 2: Check your conversion math. Multiply your monthly organic traffic by your conversion rate and average deal value. If 10,000 visitors × 1% conversion × $500 LTV = $50,000/month, your traffic is working — regardless of how it compares to competitors.
Step 3: Compare your traffic sources. If organic is below 40% of total traffic for a content-driven site, your SEO has a structural problem (not a content-volume problem). If organic is above 70%, you have a diversification problem — a Google algorithm update could wipe out most of your traffic.
Step 4: Check the trend. One month of traffic data is noise. Six months is a signal. If your 6-month trend is flat or declining while your industry is growing (see the trends table above), you are losing competitive ground. If your industry is declining but you are flat, you are gaining share.
Common Mistakes When Using Traffic Benchmarks
1. Benchmarking against the wrong industry. A B2B SaaS company comparing itself to "Computers & Electronics" will think it is failing. A local plumber comparing to "Home & Garden" will think it is crushing it. Match your business model, not just your topic.
2. Ignoring visitor value. 1,000 monthly visitors who convert at 3% with a $5,000 ACV is $150,000 in pipeline. 100,000 visitors at 0.1% conversion with $0.50 RPM is $50. Traffic volume is meaningless without the conversion equation.
3. Comparing total visits to organic clicks. Many traffic benchmarks — especially those from SimilarWeb — report total visits across all channels. Organic clicks from Google Search Console are typically 40–60% of total visits. Make sure you are comparing apples to apples.
4. Using one month as your benchmark. Seasonality, algorithm updates, and competitor launches create month-to-month noise. Use a 6-month or 12-month median for a stable benchmark.
5. Treating DR as a goal rather than a diagnostic. High DR correlates with traffic but does not cause it. A site with DR 70 and thin content will underperform a DR 30 site with exceptional topical depth. Build authority through content quality, not link volume.
FAQ
What is a good amount of website traffic?
It depends on your business model. A SaaS company can thrive on 10,000 monthly organic visits; a news publisher needs 100,000+. Compare your traffic against the industry + DR + site-size medians in the tables above, not against an absolute number.
Is organic traffic still growing in 2026?
Mixed. SaaS organic traffic is growing 12% YoY and local services 9%. News and media are declining 18% due to AI Overviews. The overall trend: industries where the SERP can answer the query are losing traffic; industries where the user needs to take action are holding or growing.
How reliable are third-party traffic estimates?
Tools like Ahrefs and Semrush estimate organic traffic based on keyword rankings and estimated CTR — they do not have access to actual analytics. Google Search Console is the only source of real organic click data for your site. Use third-party estimates for competitor benchmarking (directionally useful) and GSC for your own reporting (ground truth).
How many monthly visitors does the average website get?
The median site across all industries gets roughly 500–1,500 organic clicks per month. But 96.55% of pages get zero traffic. The "average" is pulled upward by a tiny number of giant sites. If you are getting consistent organic traffic at all, you are already ahead of most pages on the web.
What percentage of traffic should be organic vs. direct vs. paid?
For content-driven sites: 50–65% organic, 15–25% direct, 5–15% social, 5–10% referral. For ecommerce: 40–55% organic, 20–30% paid, 10–20% direct. For B2B SaaS: 55–65% organic, 20–25% direct. If organic is below 40% for any content-driven business, SEO needs attention.
Author: Marcus Ellery, Growth Experimenter Behind 150+ SEO Tests at Auspia. Marcus writes about SEO benchmarks, data-driven diagnostics, and evidence-led frameworks for growth teams.