

🎬 Watch the 90-Second Video Summary
>
Prefer to watch? We made a narrated explainer covering the key points.
>
▶ Watch the video
Do infographics still work for SEO in 2026?
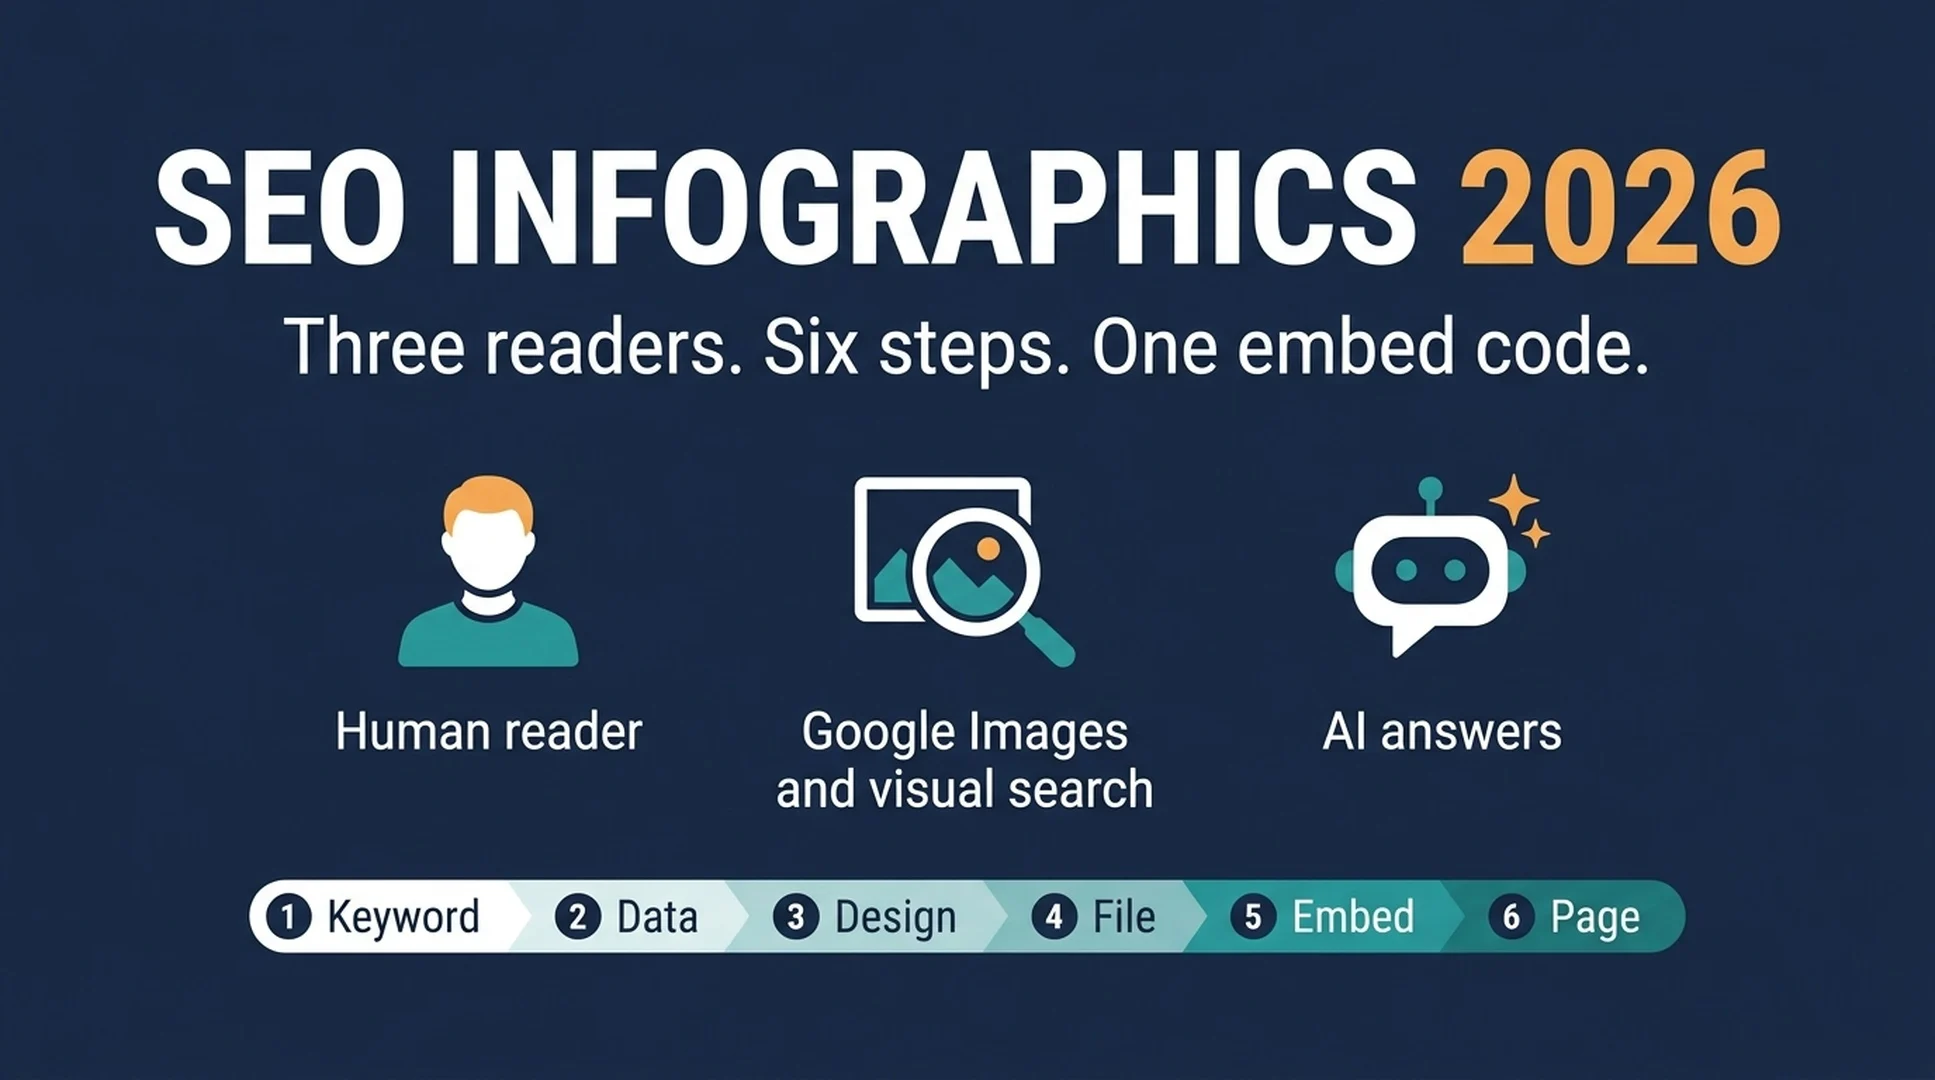
Yes — but the reader changed. An infographic still earns organic backlinks, image-search impressions, and brand awareness when it is built on data and published the right way. What changed is that an infographic now has three readers at once: the human scrolling your page, Google's image search and vision systems, and AI answer engines that treat your image and its surrounding text as evidence. Google's AI Overviews even started generating their own images inside search results on July 14, 2026, which means your infographic is rarely displayed in the answer box itself — it earns visibility by making the page around it clear, citable, and machine-readable.
Who this guide is for. Bloggers, small-site owners, and solo marketers with no design or coding background who want an infographic to actually pay off.
What you'll finish with. A live infographic on an optimized page, a descriptive file and alt text, an embed code that turns every reuse into a backlink, ImageObject schema, and a page that is readable by both people and AI.
Time and prerequisites. Budget 3–5 hours for your first infographic. You need a topic with real data, a free or cheap design tool (Canva, Piktochart, Venngage, Visme, Infogram, or Adobe Express all work), and a blog or landing page to publish on. No API keys, no paid SEO tools required.
Definition of done. The infographic is live with a keyword-rich filename and alt text, it sits inside a 1,000–2,000-word text article, the page has an H1, meta description, and ImageObject schema, the embed code is in place, and you have a short list of sites to reach out to.
What an infographic is (and is not)
An infographic is a visual summary of information that lets a reader grasp a topic or dataset at a glance. The useful ones share a shape: a clear headline, a logical flow, and one or two visual forms — a bar chart, timeline, comparison, map, checklist, or how-to sequence — backed by sourced data.
That's also what it is not:
- Not a decorative hero image. If the graphic doesn't carry information a reader can't get faster from your text, it won't earn links.
- Not an image-only post. An infographic with no supporting article is nearly invisible to search engines and AI readers. Text is what makes the image explainable and citable.
- Not a chart dump. Ten charts with no narrative or takeaway is a screenshot collection, not an infographic.
The three readers of an infographic in 2026
Reader | What they do with your infographic | What they need from you |
|---|---|---|
Human visitor | Views it, understands the data, shares or embeds it, links to your page | Clear design, a story, a takeaway, a shareable embed code |
Google Images & visual search | Indexes and ranks the image as its own search result | Descriptive filename, alt text, page context, 1,200px+ width, fast-loading WebP/PNG |
AI answers (AI Overviews, ChatGPT, Gemini) | Reads the image as data: OCR text, XMP metadata, alt text, and the text around it; cites the page | An HTML text version, the core answer near the top of the page, structured data, entity clarity |
The middle row is the classic play. The bottom row is the 2026 addition. Multimodal models extract meaning from the image itself — pixel patterns, extracted text, embedded metadata — but they validate an infographic against the page that contains it. The image cannot carry the page; the page must carry the image.
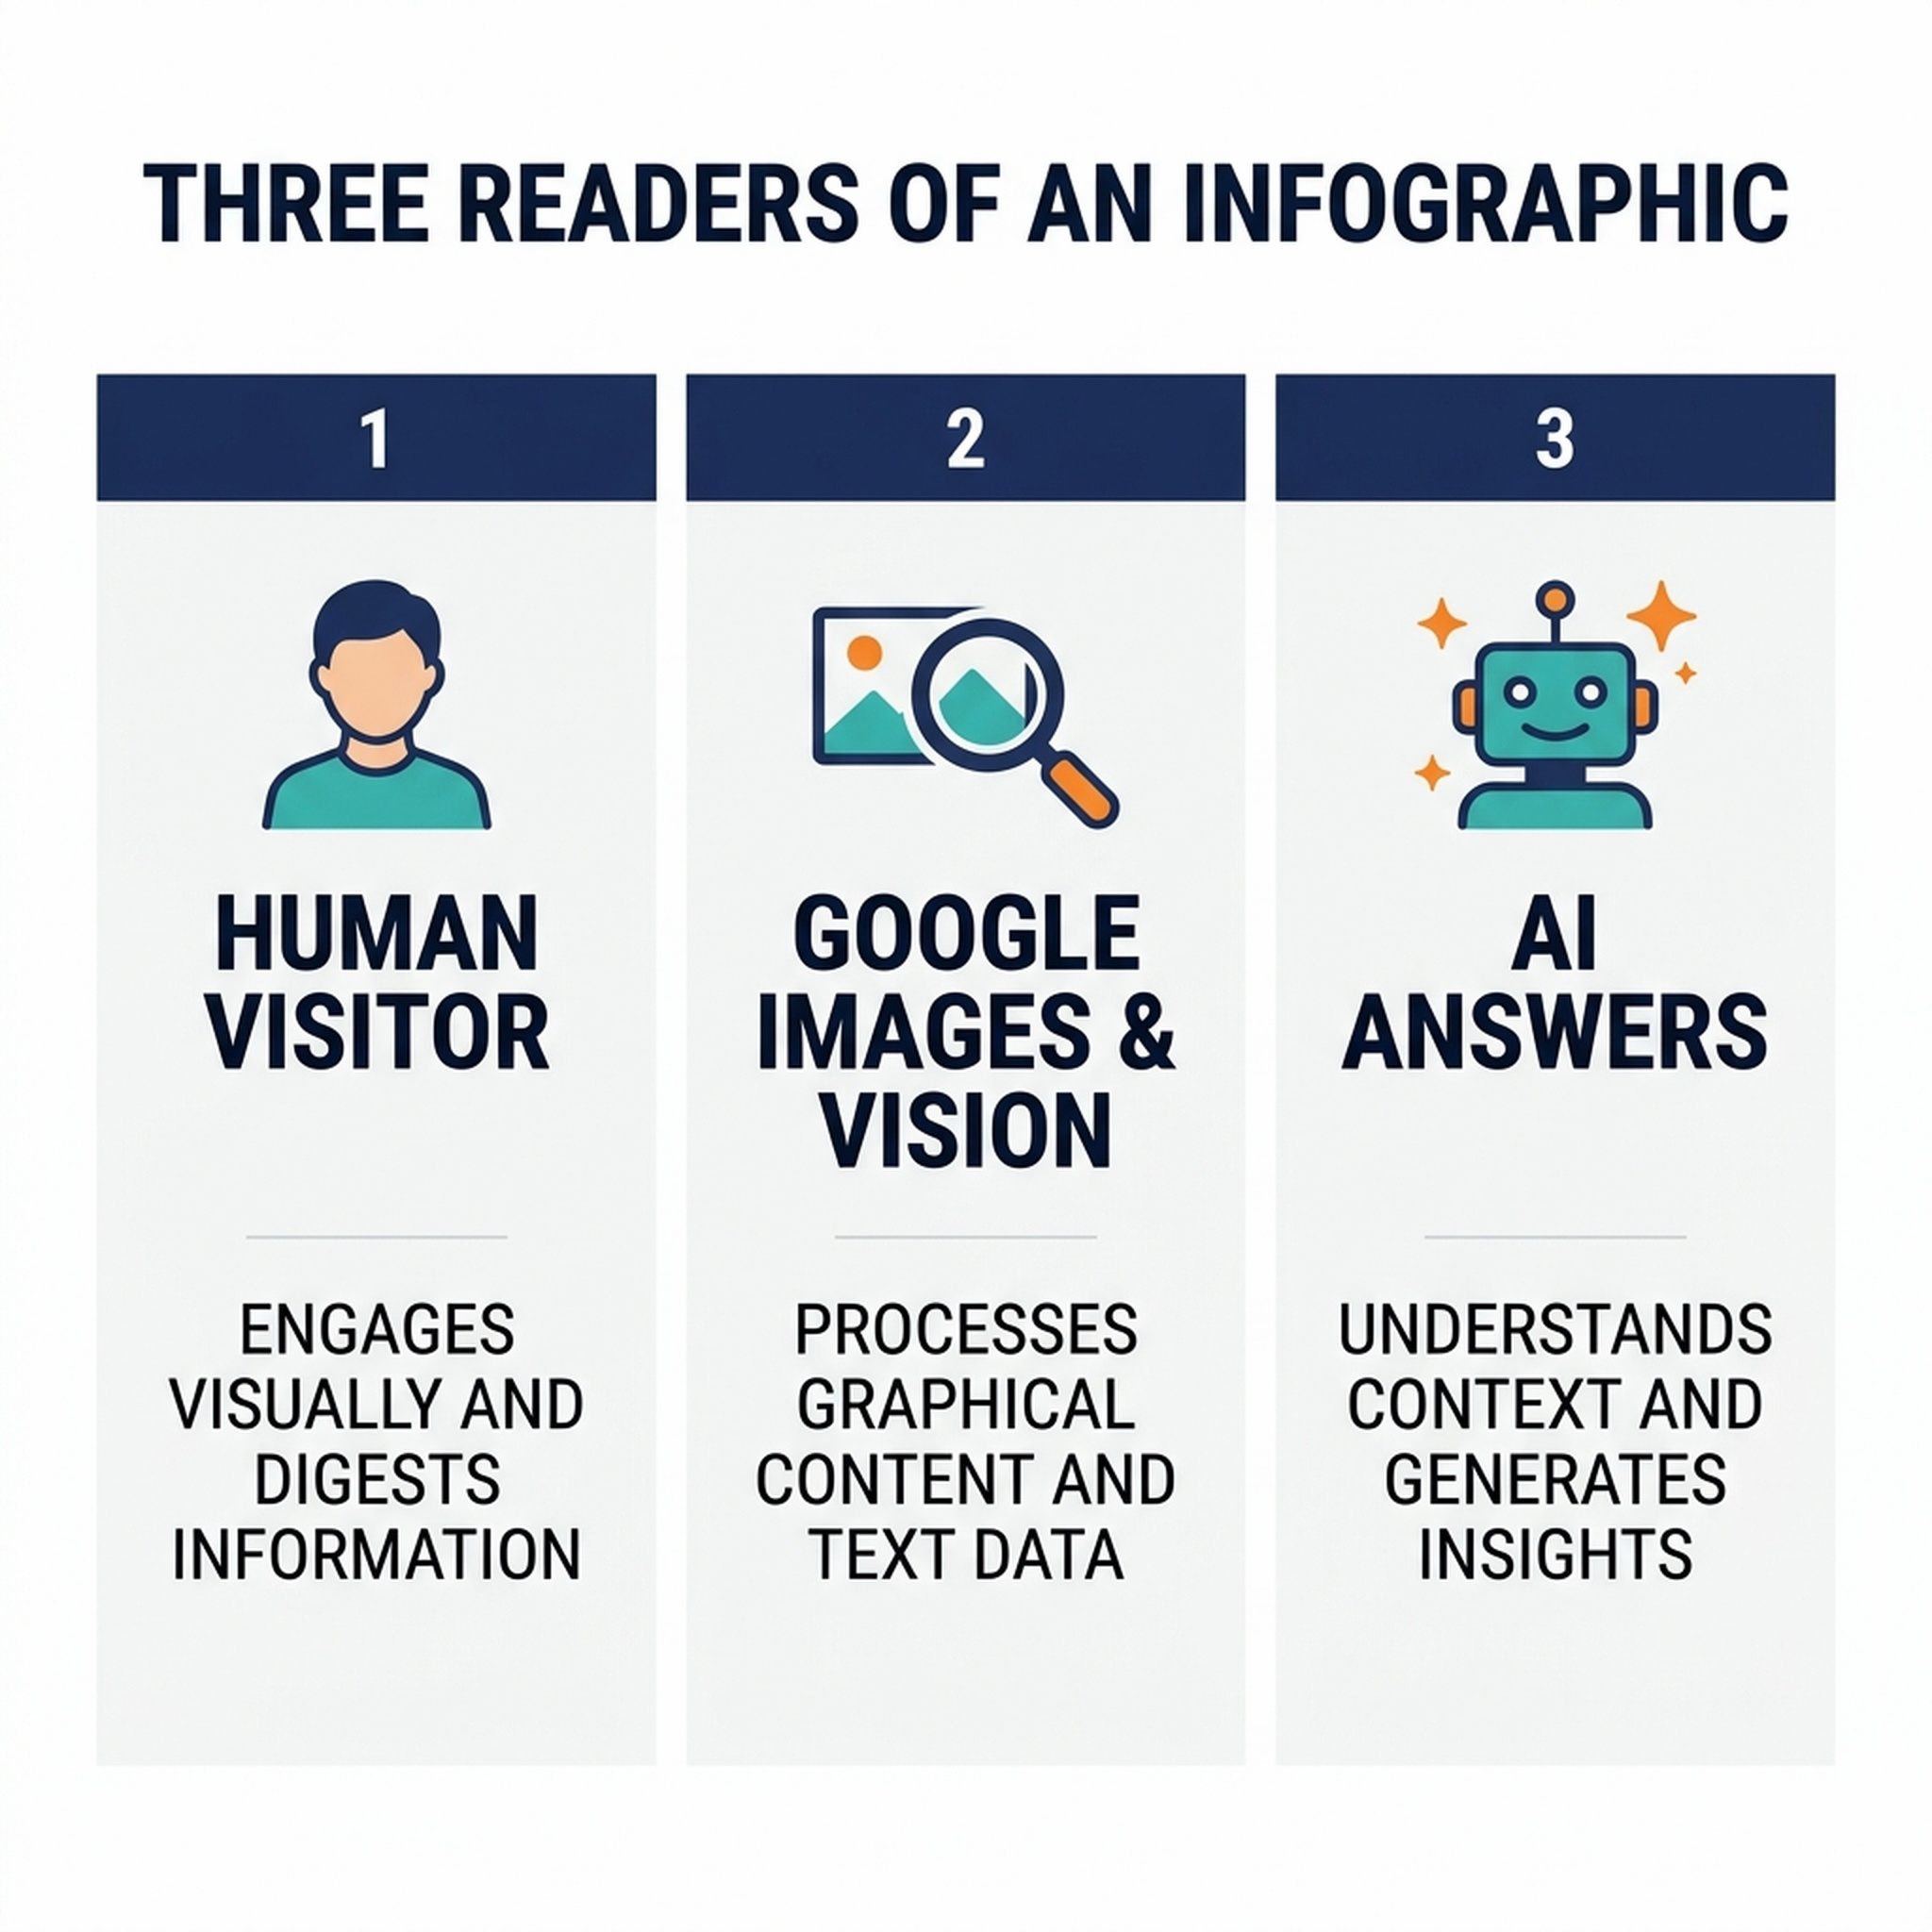
Figure 1. An infographic has three simultaneous readers in 2026 — optimize for all three.
How an infographic earns SEO value
Four mechanisms, in rough order of leverage:
- Backlinks. An infographic is still one of the most-shared linkable formats. When you provide an embed code, every site that reuses your visual links back to you. Reported data from 2026 roundups keeps pointing the same direction: visual assets consistently out-earn plain text for inbound links.
- Image search and visual search. Google Lens handles roughly 12 billion visual searches a month according to reported 2026 estimates — about a fifth of Google search traffic. An optimized image can show up in Google Images, which is its own SERP feature with its own clicks.
- Brand awareness. A well-designed infographic gets shared on LinkedIn, Pinterest, and newsletters under your name, which compounds brand recall beyond the single post.
- AI citation context. Infographics summarize complex answers, and pages with clear, extractable summaries are what AI answers cite. A widely repeated benchmark says infographics can lift web traffic by 12% or more (HubSpot-origin, reported); treat it as a directional signal, not a guarantee.
One important reality check: AI Overviews increasingly generate their own images rather than displaying yours. So stop optimizing for "get my infographic shown inside an AI answer." Instead, optimize the page so AI can extract and cite your numbers — the infographic makes that page worth citing.
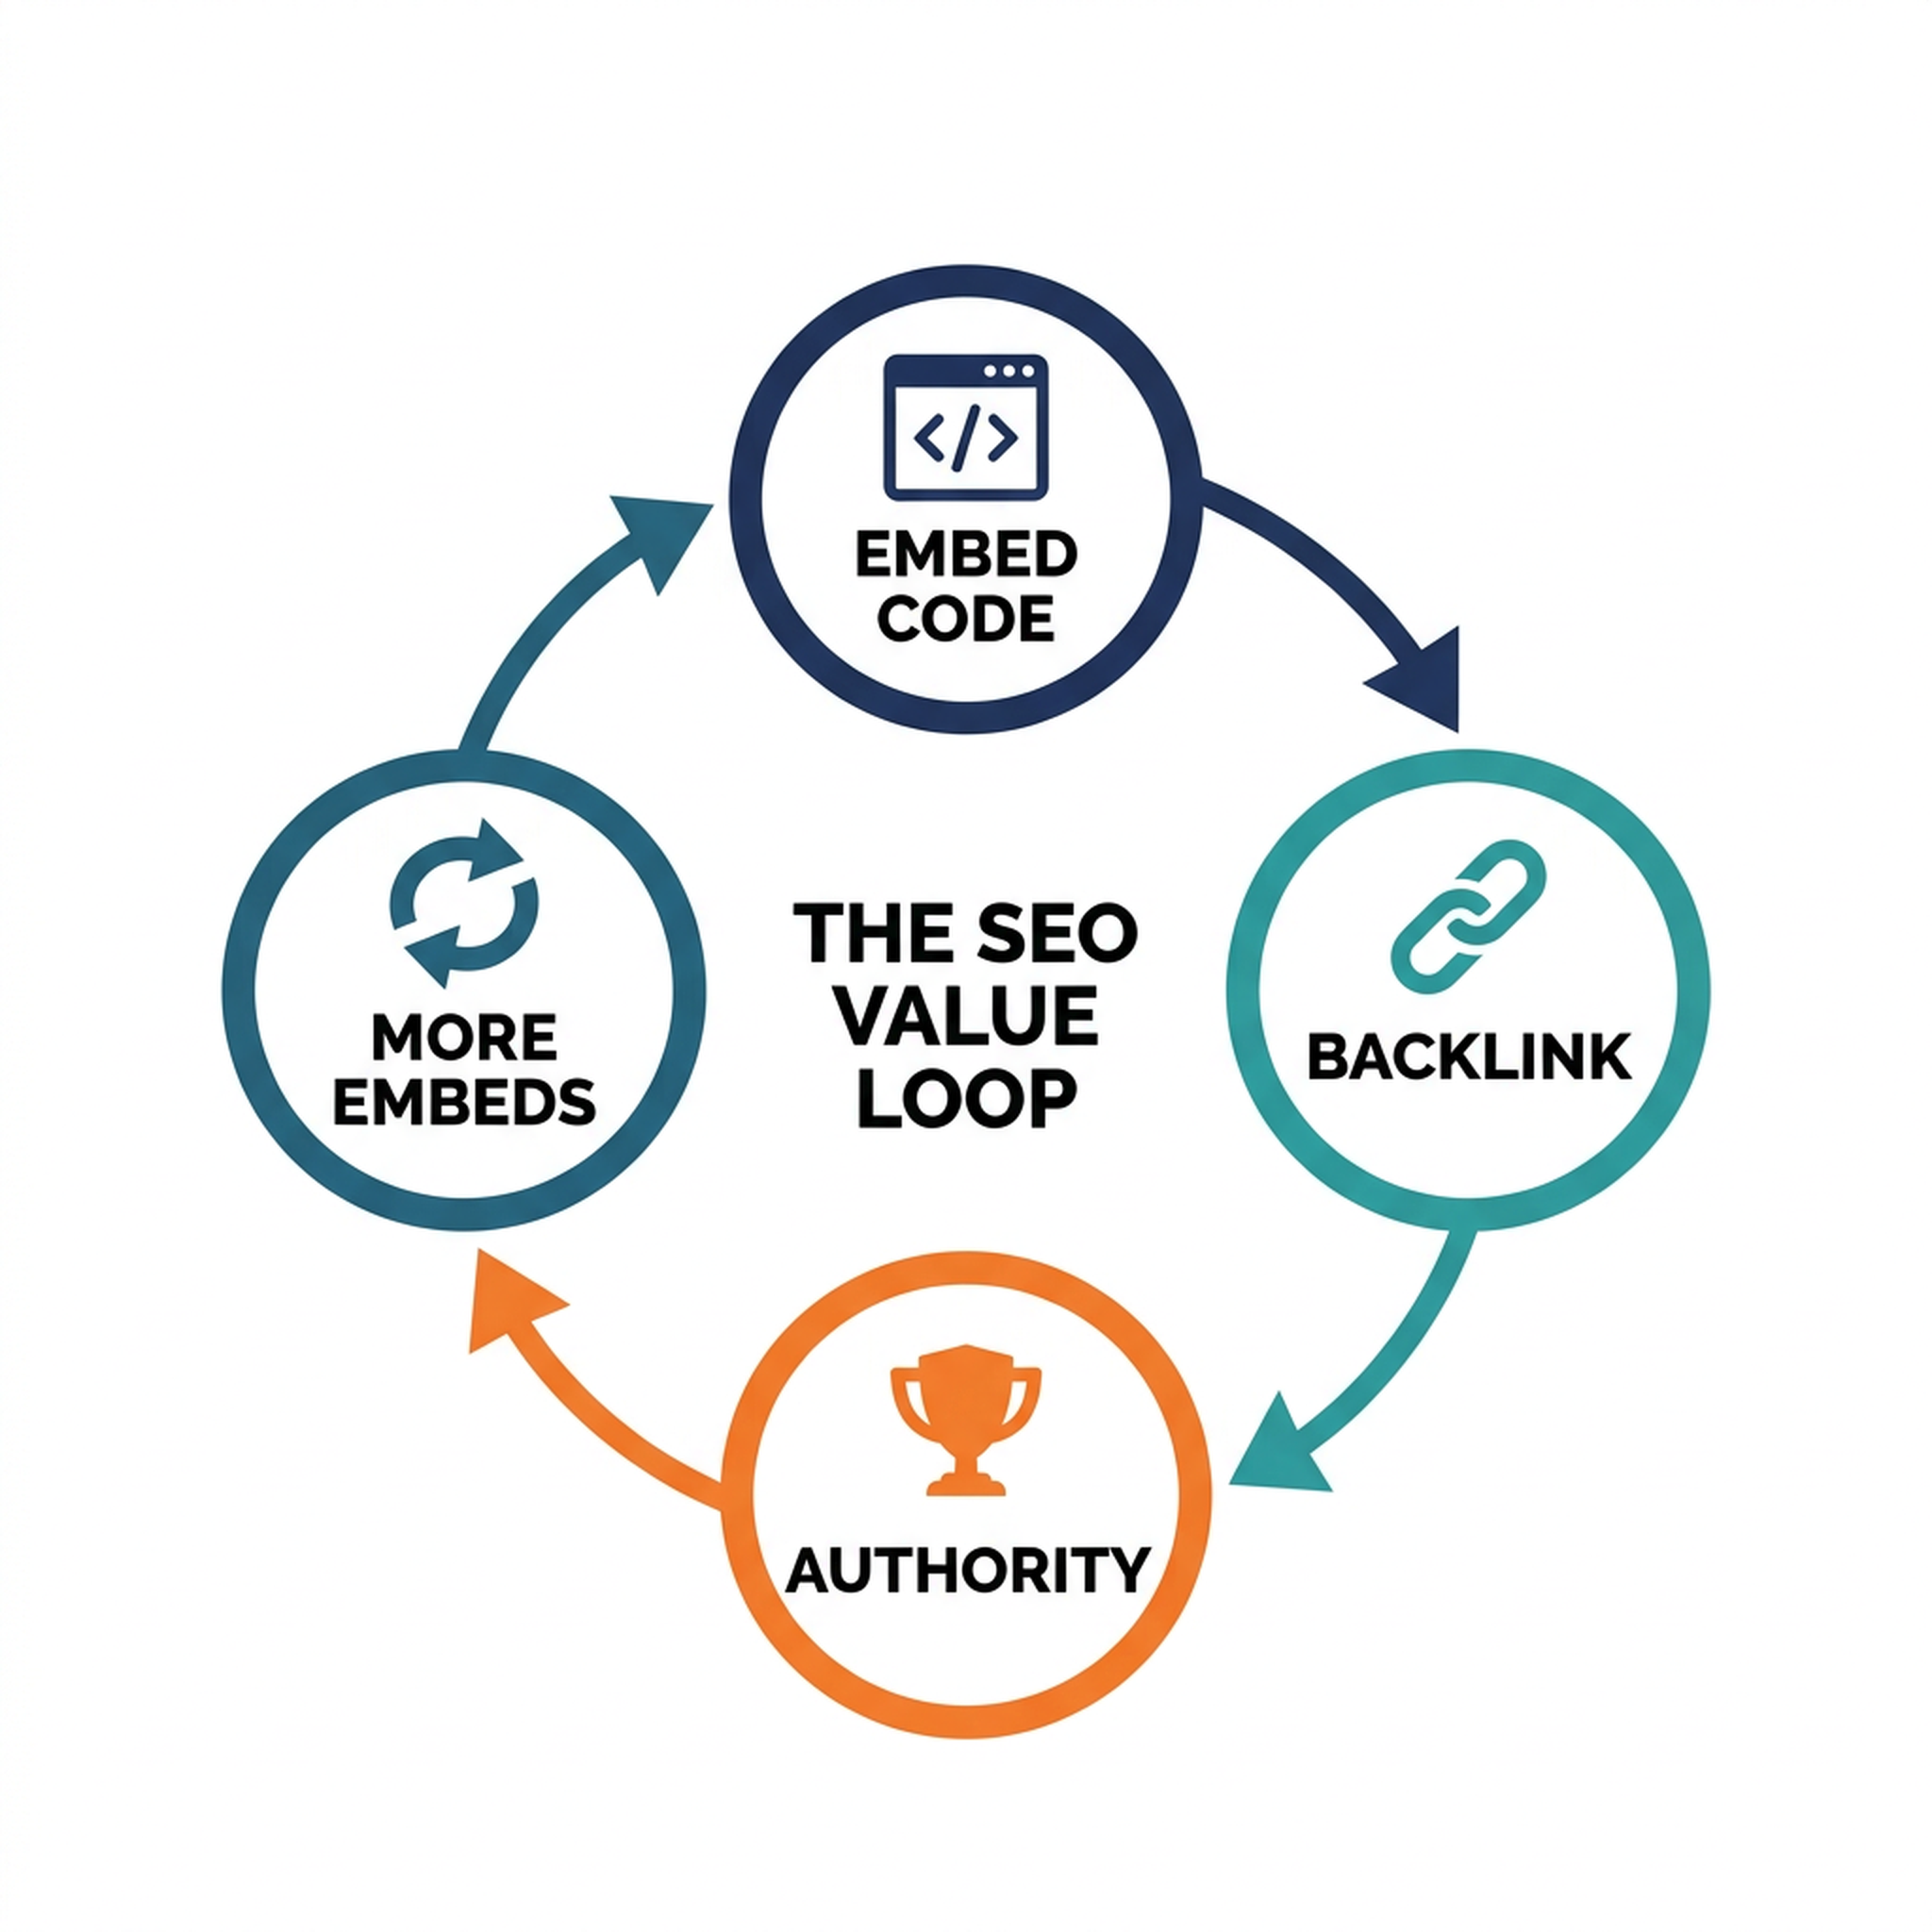
Figure 2. The embed loop is a self-reinforcing flywheel — every embed is a backlink, and authority compounds.
The 2026 optimization workflow
Work through these six tasks in order. Each one has an action, the output you're looking for, a quick quality check, and a way to recover if it goes wrong.
1. Choose a keyword and a real question first
Action. Pick one target keyword and the question behind it. Good patterns: seo infographics, what is an infographic, [topic] statistics 2026, how to [process] in 2026. Use the free keyword surfaces you already have — Google autocomplete, People Also Ask, or a Search Console export if you have one.
Expected output. One primary keyword, the question it maps to, and the search intent (information, comparison, statistics).
Quality check. The infographic must be the best way to answer that question. If a plain paragraph answers it, an infographic is wasted effort.
Recovery. If the question is too broad, narrow it to a dataset or a process ("email marketing statistics 2026" instead of "marketing").
2. Build the visual story on original or sourced data
Action. Gather the numbers and sources before you open a design tool. Original data — a survey, a usage dataset, your own analytics — earns more links because no one else has it. If you use published data, cite every source directly on the graphic and in the article.
Expected output. A one-sentence takeaway plus 5–8 data points that support it, each with a source and a date.
Quality check. If you removed the design, would the remaining facts still be worth sharing? If not, you don't have an infographic yet.
Recovery. Run out of sources? Swap in a simpler visual form (a comparison or timeline) rather than padding with weak data. Never invent statistics to fill space.
3. Design for humans and machines
Action. Use one clear headline, a logical reading flow, consistent brand colors, and 2–3 fonts max. Keep text legible and labels accurate — vision models read the text inside your image, so a chart with unlabeled axes or cut-off numbers reads as noise to both people and AI.
Expected output. A 16:9 or 4:3 graphic with a headline, numbered sections, and a takeaway bar at the bottom.
Quality check. A colleague who hasn't seen it can explain the takeaway in one sentence after 10 seconds of looking.
Recovery. If it's cluttered, cut one visual form. Three clean sections beat six crowded ones.
4. Export a machine-readable file
This is where most infographics die for SEO. Google's guidance has been consistent: descriptive filenames and alt text, high-resolution images, and modern formats. In 2026, vision models add a layer — they read file names, alt text, and embedded metadata directly.
Action.
- Filename: keyword-rich and descriptive.
email-marketing-statistics-2026-infographic.webp, notfinal_v3_final.png. - Alt text: describe what the image shows, in under ~125 characters, including the primary keyword naturally. Never keyword-stuff.
- Format and size: export at least 1,200px wide (1,600–2,400px is ideal), and prefer PNG for text-heavy diagrams (cleaner text) or WebP when it preserves quality. Compress so the file stays under ~300KB when possible.
- XMP metadata: when your tool allows it, embed a title, one-sentence description, your brand as author, and copyright into the file itself. This travels with the image wherever it's embedded.
- Performance: never lazy-load the hero/LCP image — it delays rendering and hurts Core Web Vitals. Lazy-load only images below the fold.
Expected output. One optimized file with a descriptive name, alt text, and metadata, sitting at 1,200px+.
Quality check. Read the file name out loud. If it describes the image, it's right.
Recovery. If the design tool exports only JPG, you're fine for photos — but for text-heavy infographics prefer PNG, and always keep a high-resolution master.
5. Make it embeddable and shareable
Action. Publish the infographic inside a blog post, then add a small embed code block below it. The embed code is HTML that other webmasters can copy-paste; it renders your image and links back to the page. Offer it prominently with text like "Embed this infographic on your site."
Expected output. A copy-paste embed block that contains four components:
Component | Why it matters |
|---|---|
Keyword anchor text | The visible link text (e.g., "Email Marketing Statistics 2026") — a relevant, natural anchor instead of generic "source" |
Link to the full article URL | Points to the blog post, not the raw image file or CDN — this is what passes the link |
Brand name | Credit line ("Infographic by Auspia") reinforces brand mention alongside the link |
Image dimensions | Width/height attributes prevent layout breakage on the reuser's page |
Quality check. Paste the embed code into a test page and confirm the image loads and the link points to the article.
Recovery. No link = no value. If the embed links to the raw image file, fix the href to the article URL — otherwise every embed is a lost backlink.
6. Optimize the whole page
Action. The infographic is a feature of the page, not the page itself.
- H1: include "infographic" or the keyword naturally, e.g. "Email Marketing Statistics 2026: Infographic and Data".
- Meta description: under ~155 characters, one sentence on what the page answers plus a hook.
- Supporting text: 1,000–2,000 words of real prose around the image, so the page is readable and citable even if the image never renders.
- ImageObject schema: mark up the infographic with structured data. In 2026 Google expanded ImageObject with
creator,creditText, andcopyrightNoticeproperties — exactly what an infographic needs for attribution. There is no guarantee schema gets you into AI Overviews, but it makes your authorship and license machine-clear. - Put the answer near the top: a 2026 study of 100 AI Overview citations found ~55% come from the top 30% of a page. State the core answer and the infographic's takeaway in the first 150–200 words.
Expected output. A published page with H1, meta description, prose, ImageObject schema, and the answer in the opening.
Quality check. Open the page as a stranger: can you get the takeaway from the first screen, and is the infographic the strongest visual on it?
Recovery. If the page feels thin around the image, add an interpretation section — what the data means, why it matters, and what to do about it.
Hand the whole workflow to Codex: a copy-paste skill
The workflow above is repeatable, which makes it a perfect job for a coding agent like Codex. Below is a complete skill file you can save and use directly. It turns the six tasks into a guided run: it will research your topic, draft the page copy, generate the embed code, and produce the schema — but it will not fabricate search volume, rankings, or data. Anything it can't source, it flags for you.
---
name: seo-infographic-optimizer
description: Optimize an infographic for search traffic in 2026 — keyword target, data story, design and export spec, embed code, page metadata, and AI-readability. For beginners; no paid tools or API keys required.
---

# SEO Infographic Optimizer

Build a complete SEO package around one infographic: keyword, story, file spec,
embed code, schema, and verification checklist.

## Input

Ask the user for:
- Website URL and one-sentence description
- Topic or seed phrase (e.g., "email marketing statistics 2026")
- Target market/country and language (default: English, US/global)
- Audience (e.g., marketing managers) and business goal (traffic, links, signups)
- Optional: Google Search Console export, Google autocomplete, or People Also Ask notes

## Prerequisites

- No API keys, no paid SEO tools, no credentials required.
- Only use data the user provided or data you can verify from public sources with a
  date and URL. Never invent statistics, search volume, difficulty, SERP positions,
  competitors, or client results.
- Never write API keys, tokens, cookies, or private data into output files.

## Steps

1. **Choose keyword and intent.** Suggest one primary keyword and the question it maps
   to. Label intent: informational, comparison, or statistics. If the user provided a
   Search Console export, derive real query data; otherwise mark search volume as
   "requires tool data — not estimated."
2. **Outline the data story.** Produce a one-sentence takeaway and 5-8 candidate data
   points. For each point, require a source URL and date, or mark it "unverified."
3. **Write the supporting article draft.** Draft 1,000-2,000 words with: a direct
   answer in the first 150-200 words, H1 suggestion, meta description (under 155
   characters), the infographic summary, and an interpretation section.
4. **Specify the file export.** Output exact guidance: keyword-rich filename, alt text
   (under ~125 characters), 1,200px+ width, PNG for text-heavy diagrams or WebP,
   XMP metadata fields (title, author, description, copyright).
5. **Generate the embed code.** Produce an HTML embed block with: keyword anchor text,
   a link to the article URL, the brand name, and image dimensions. Never point the
   link at the raw image file.
6. **Build the schema.** Output an ImageObject JSON-LD block with contentUrl plus
   creator, creditText, copyrightNotice, and license. Explain that schema does not
   guarantee AI Overviews or rich results.
7. **Create the distribution checklist.** List 10 target sites to reach out to,
   relevant forums/subreddits, Pinterest and LinkedIn, and one short outreach message
   template that links to the article.
8. **Verify.** Produce a final checklist: file live, alt text set, page has H1 + meta,
   schema added, embed code tested, answer in the first 200 words.

## Output

- Keyword and intent summary table
- Data story with sources (or unverified flags)
- Article draft (plain Markdown, no H1 inside body)
- File export spec
- Embed code HTML block
- ImageObject JSON-LD block
- Distribution checklist and outreach template
- Verification checklist

## Limits

- Do not fabricate any metric, SERP, competitor, or result.
- If the user has no Search Console export and no tool data, say "no volume data —
  not estimated" instead of guessing.
- Do not claim schema or any single tactic guarantees rankings, AI Overviews, or rich
  results.
- Do not publish anything to a live site without explicit user approval.
Save that file as seo-infographic-optimizer.md, drop it in your Codex skills folder (or paste it as a prompt), and point Codex at your topic. The agent handles the research, writing, embed code, and schema; you approve the output and publish.
Beginner mistakes that kill infographic SEO
- Publishing an image with no article. The image is invisible to search and AI without text around it.
- Naming the file `final-final-v2.png`. Descriptive filenames are free ranking signal.
- Forgetting the embed code. Without it, sites that want your graphic have to ask — and most won't.
- No sources on the graphic. Data without citations is a claim, not an asset; editors won't link to it.
- Skipping the schema. Infographic attribution is exactly what
creatorandcreditTextwere made for. - Burying the answer. If the takeaway is 900 words down the page, AI answers may never reach it.
The 60-minute verification checklist
- [ ] Infographic is live inside a page with 1,000–2,000 words of text.
- [ ] File is 1,200px+ wide, PNG or WebP, under ~300KB.
- [ ] Filename is descriptive and keyword-rich.
- [ ] Alt text describes the image and includes the keyword naturally.
- [ ] XMP metadata (title, author, copyright) is embedded where supported.
- [ ] H1 and meta description are set; answer is in the first 200 words.
- [ ] Embed code is on the page and links to the article URL.
- [ ] ImageObject schema with
creator/creditTextis added and validated. - [ ] The hero image is not lazy-loaded.
- [ ] You have a list of 10 sites to pitch, with a one-line message.
FAQ
Do infographics still work for SEO in 2026? Yes, for backlinks and image-search traffic. They won't be displayed inside Google's AI Overviews — Google now generates its own images there — so the value is in making the page around the infographic clear, citable, and shareable.
What file format is best for an SEO infographic? PNG for text-heavy diagrams (cleanest text), WebP when it preserves quality, at least 1,200px wide. JPG is acceptable for photo-based visuals but softens small text.
How long should the article next to an infographic be? Roughly 1,000–2,000 words of supporting prose. That range is enough to explain the data, satisfy the image's context, and stay readable for AI answers.
Do I need an embed code? Yes, if you want links. An embed code converts every reuse of your infographic into a backlink with attribution — it's the difference between "please link us" and links arriving on their own.
Will schema get my infographic into AI Overviews? No guarantee. Schema — especially ImageObject with creator and creditText — makes your authorship machine-clear and supports licensing badges, but no single tactic guarantees an AI Overview, rich result, or ranking.
What is XMP metadata and do I need it? It's machine-readable data embedded in the image file itself (title, author, description, copyright). Vision models read it, and it travels with the image when someone reuses it. Recommended, but optional if your tool doesn't support it.
Author: Elise Morgan, 15-Year Editorial SEO Strategist at Auspia. Elise writes about content quality, refreshes, and rewrites — and how to make visual assets earn their place in search.