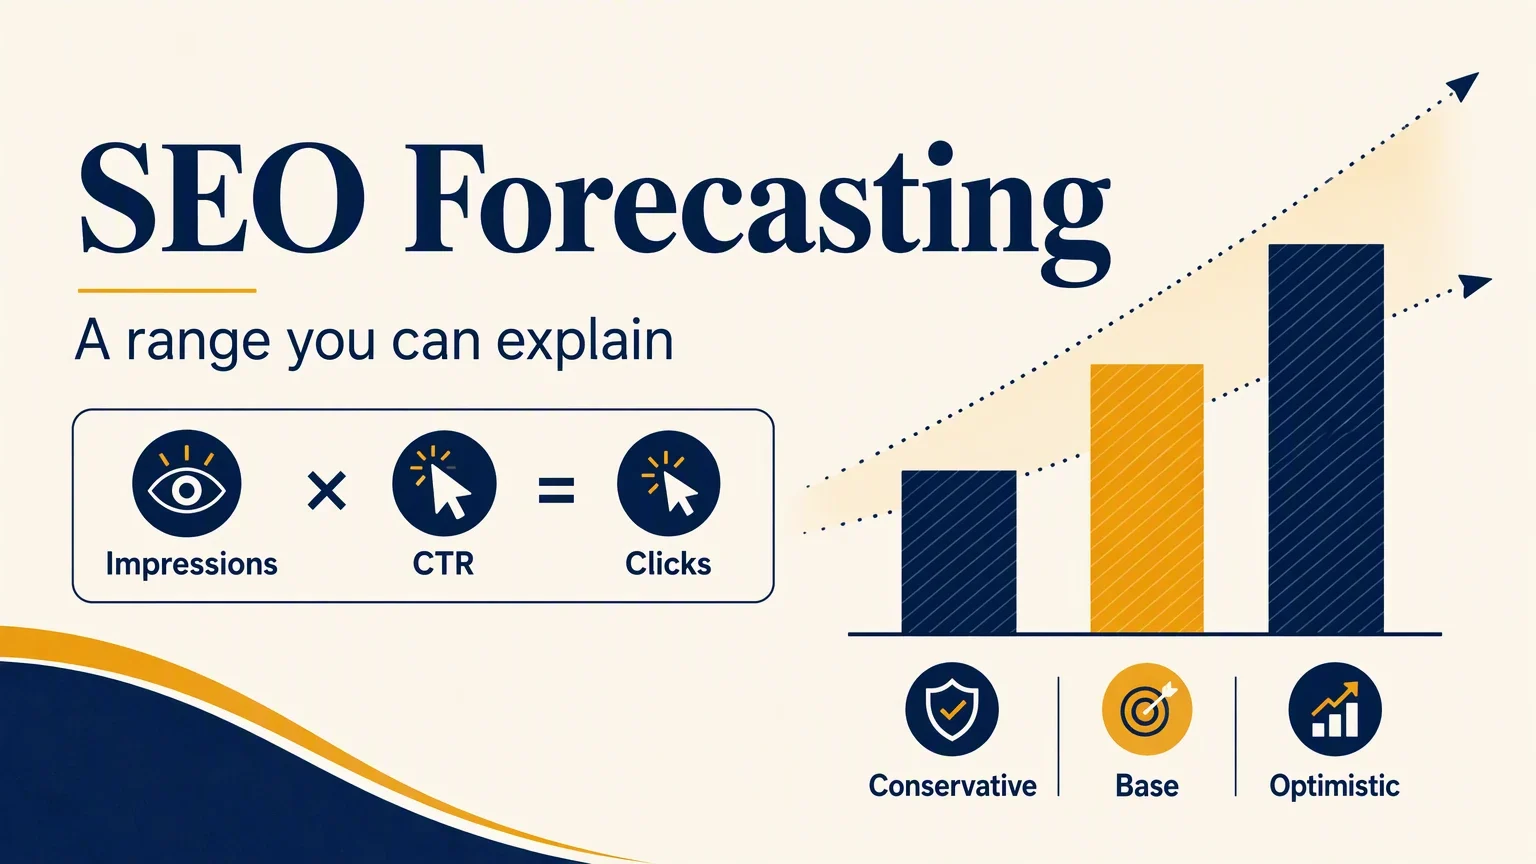
An SEO forecast estimates what traffic could look like under stated assumptions. The most useful version begins with your own search data and shows a range of outcomes, with the work and conditions required for each. A growth percentage without assumptions leaves the team guessing when the month ends.
For pages already appearing in Google Search, a workable starting equation is:
Forecast clicks = forecast impressions × forecast CTRBoth inputs need a reason to change. Publishing five articles does not, by itself, establish an impression increase. Moving a target keyword to a better position does not establish a particular CTR for every device and result layout.
Who this is for: A marketer planning an existing site's next quarter. Inputs: Search Console exports, an agreed page group, at least several comparable periods where available, and a list of planned changes. Deliverable: Conservative, base, and optimistic scenarios with a dated assumptions log. Definition of done: Someone else can recalculate the numbers, see where each input came from, and identify which assumptions have failed. A first version can fit into an afternoon when the exports are ready.
Build a baseline that you can recognize next month
Choose the part of the website you intend to change. A product-page program, an English-language help center, and the whole domain should not share an unexplained baseline.
Export impressions and clicks for that group from Search Console. Keep the same search type, country, device filters, and date boundaries when comparing periods. Google's performance report lets you choose dimensions and date ranges; CTR is clicks divided by impressions. Search Console's report documentation
Calculate the group's CTR from total clicks and total impressions. Do not take an unweighted average of row CTRs: a page with ten impressions should not carry the same weight as one with ten thousand.
Your baseline record should contain the period, filters, page group, impressions, clicks, and calculated CTR. Compare it with the property view at the same scope and note any export or aggregation limitations. If query rows do not reconcile to a report total, use a consistent total for the forecast and keep the query rows for diagnosis.
If you have too little history, shorten the claim. A recent site's observed baseline can support a near-term scenario, while a precise annual growth curve would lean heavily on assumptions.
Separate traffic you have from opportunities you have not earned
Split the program into three buckets before choosing growth rates:
Bucket | Evidence available | Forecast treatment |
|---|---|---|
Existing pages with stable observations | Search impressions, clicks, and known page behavior | Use a measured baseline and explicit adjustments |
Existing pages receiving a defined repair | Baseline plus a dated change plan | Model a conditional improvement and its delivery timing |
New pages or a new market | Research and implementation plan, little or no page history | Keep as a separate opportunity scenario until data arrives |
This separation prevents an optimistic new-content plan from quietly inflating an otherwise grounded forecast.
For a new page, keyword volume is market research, not a prediction of impressions for your site. Record an assumed share only if you can explain it, and keep that estimate outside the measured base case. When the page starts generating data, replace the market-level assumption with its observed performance.
The expected output is a baseline ledger and an opportunity ledger. If a planned page has no agreed owner or delivery date, keep it out of the committed scenario.
Give each change a named assumption
For each existing-page group, decide whether you expect impressions, CTR, or both to change. State why.
An impression assumption could involve a seasonal demand change or a broader set of queries after a content repair. A CTR assumption could involve a title revision, a changed query mix, or stronger visibility for a relevant group of queries. These are hypotheses to test, not effects guaranteed by the action.
Use your own comparable query and page cohorts to set a CTR range. Match device and intent where possible. A branded navigational query and a broad research question should not share a curve simply because their reported positions are similar.
Assumption record | Example, illustrative only |
|---|---|
Input affected | CTR for the existing product-page group |
Current value | 3.0% |
Base-case target | 4.0% by month three |
Reason | Planned title and page-answer revisions, informed by a comparable cohort |
Dependency | Revisions published before the planned observation period |
Evidence to revisit | Same-group CTR and query mix |
Fallback | Keep the original CTR if delivery is delayed or evidence is inconclusive |
Do not multiply two adjustments that describe the same underlying event. For example, if a rank-based CTR assumption already incorporates the expected effect of a title change, adding another title uplift would double-count the benefit.
Calculate a range with visible arithmetic
The following invented example demonstrates the method. It is not a benchmark, a prediction for Auspia, or a promise of results.
The baseline group has 10,000 monthly impressions and 300 clicks. Its CTR is 3.0%. At the month-three endpoint, the three scenarios are:
Month-three scenario | Impressions | CTR | Expected clicks | Change from the 300-click baseline |
|---|---|---|---|---|
Conservative | 9,000 | 3.5% | 315 | +15 |
Base | 12,000 | 4.0% | 480 | +180 |
Optimistic | 15,000 | 4.5% | 675 | +375 |
Each row is an alternative outcome for the same period. Adding the rows would produce a meaningless total.
The conservative row allows impressions to decline while CTR improves. That is intentional: a useful downside scenario can include weaker demand, delays, or a narrower query mix. If the proposed improvement itself is uncertain, include a scenario where CTR does not improve either.
Keep inputs in decimal form in your calculation: 12,000 × 0.04 = 480. When a spreadsheet stores "4" instead of "4%", a percent-formatting error can turn a plausible forecast into a number a hundred times too large.
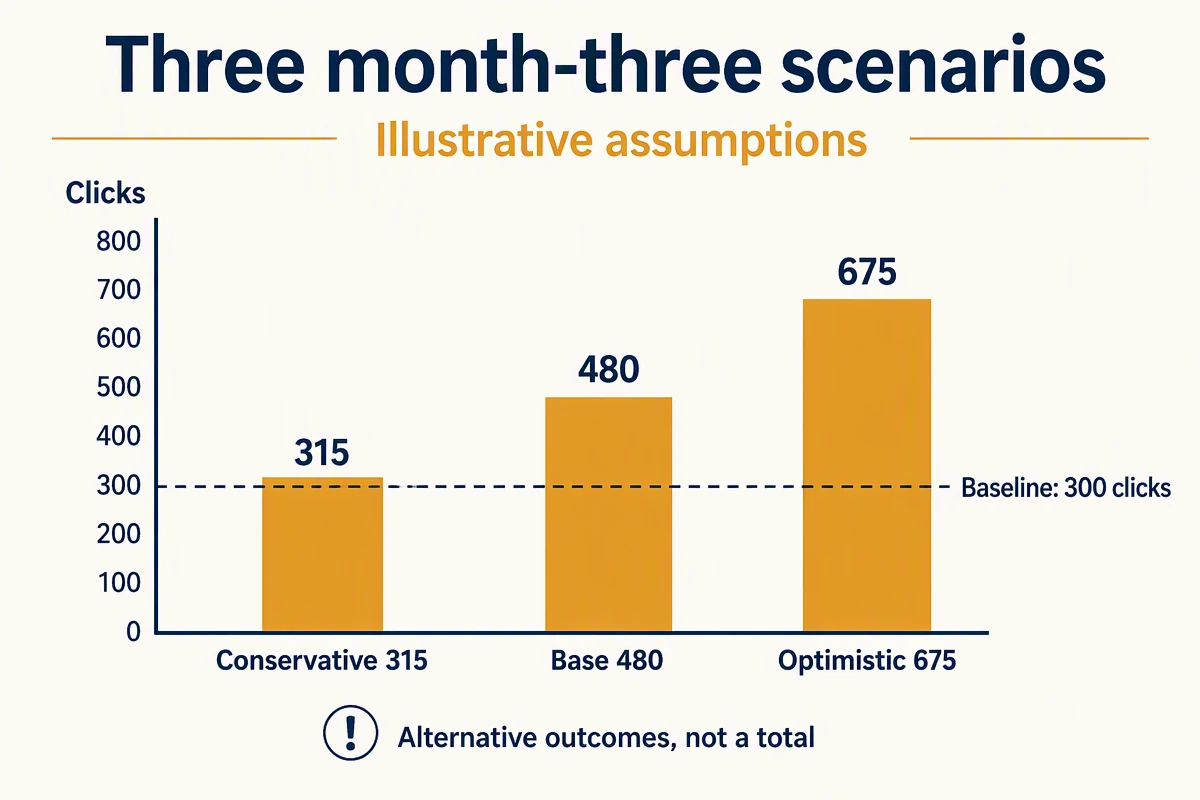
Illustrative assumptions: each bar represents a different month-three scenario.
Add the delivery ramp before presenting a quarterly total
The endpoint is not the whole quarter. A repair published late in month two cannot explain an assumed uplift throughout month one.
Here is an illustrative base-case ramp using the same group:
Month | Impressions | CTR | Forecast clicks |
|---|---|---|---|
One | 10,300 | 3.0% | 309 |
Two | 11,200 | 3.5% | 392 |
Three | 12,000 | 4.0% | 480 |
Quarter total | 33,500 | Calculated across the quarter | 1,181 |
A flat 300-click baseline would produce 900 quarterly clicks, so this modeled increase is 281. It is not the month-three uplift multiplied by three.
Write delivery and observation timing beside the ramp. If the repair is late, move the assumed uplift forward rather than leaving the forecast unchanged. Where seasonality matters, compare equivalent calendar periods when available, and record whether the demand adjustment comes from historical observations or an assumption.
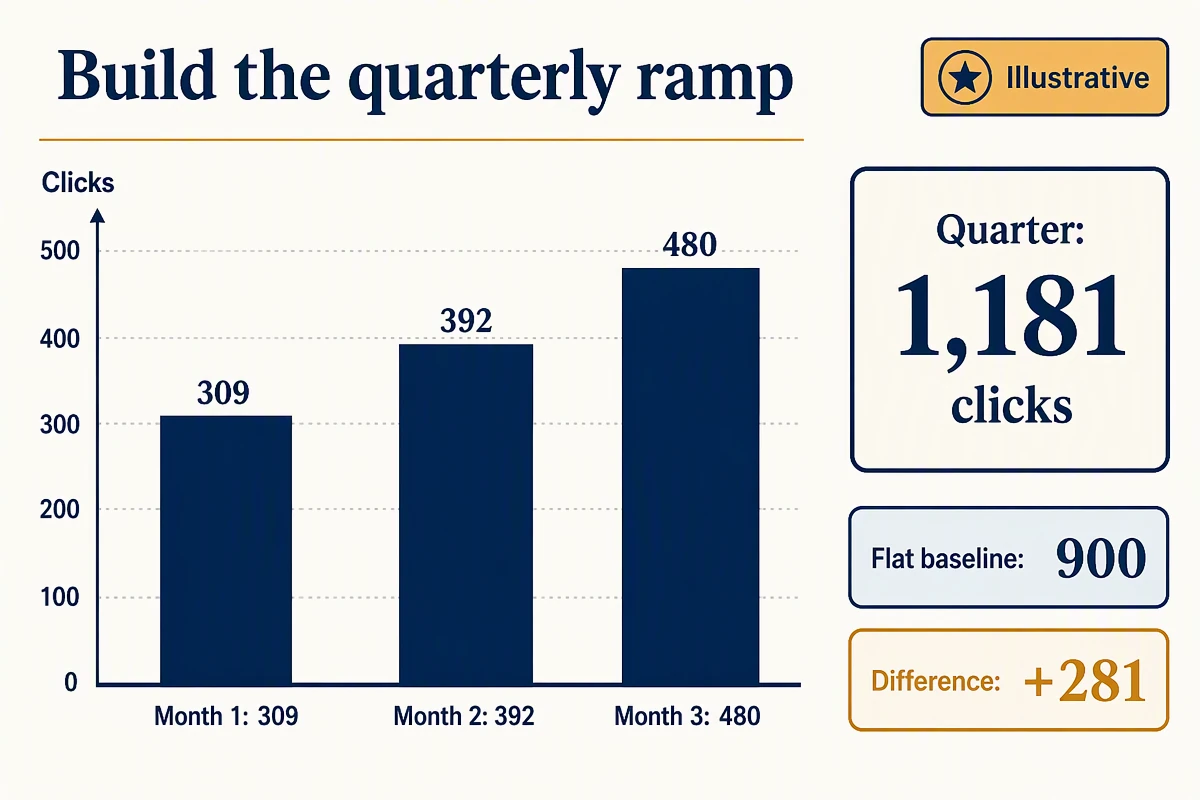
Illustrative assumptions: the quarterly ramp totals 1,181 clicks, an increase of 281.
Verify the model with two simple stress tests
First, set every growth adjustment to zero. The forecast should return the baseline under the same time structure. If it does not, inspect hidden multipliers, date ranges, and the way page groups are added.
Second, change one input at a time. In the base endpoint example:
- Keeping impressions at 12,000 but using a 3.0% CTR produces 360 clicks.
- Keeping CTR at 4.0% but using 9,000 impressions also produces 360 clicks.
The exercise shows which assumptions matter before anyone argues about the final number.
Confirm that groups do not overlap, that totals reconcile, and that every opportunity has a delivery dependency. Keep an unchanged copy of the forecast so you can compare predictions with actuals later.
Explain the forecast error through its inputs
At the next review, add actual impressions, CTR, and clicks beside the forecast. Explain the difference in terms of the inputs.
If impressions miss the plan while CTR holds, investigate demand, indexing, delivery, or query coverage. If impressions hold while CTR falls, inspect query mix and the results people actually see. If both move unexpectedly, check whether the scope or reporting definition changed before interpreting the market.
Google includes AI-feature traffic in Search Console's Web data. A forecast using that total therefore incorporates the observed search experience; adding a separate assumed "AI click uplift" on top can double-count traffic. Google's AI-feature measurement guidance
Auspia's approach is to make the assumption easy to revise. The plan should tell the team which input to check and which task to change, not punish them for missing an unexplained target.
FAQ
Can I forecast from keyword volume without Search Console history?
You can build an opportunity model, but label the assumed exposure and CTR. Keep it separate from observed traffic until the pages generate usable data.
Does an average ranking predict CTR?
It can inform a hypothesis when you compare similar cohorts. It is insufficient as a universal conversion table because the query, device, and result layout also matter.
Should I put leads in the same model?
Add a separate stage using a relevant observed conversion rate. For example, 480 forecast clicks multiplied by an assumed 2% lead rate produces 9.6 expected leads, an expectation rather than a guaranteed count. Preserve the traffic assumptions and conversion assumptions separately.
Author: Leo Harrington, SEO Analytics Translator for 500+ Executive Reports at Auspia. Leo writes about practical search measurement and reports that support business decisions.